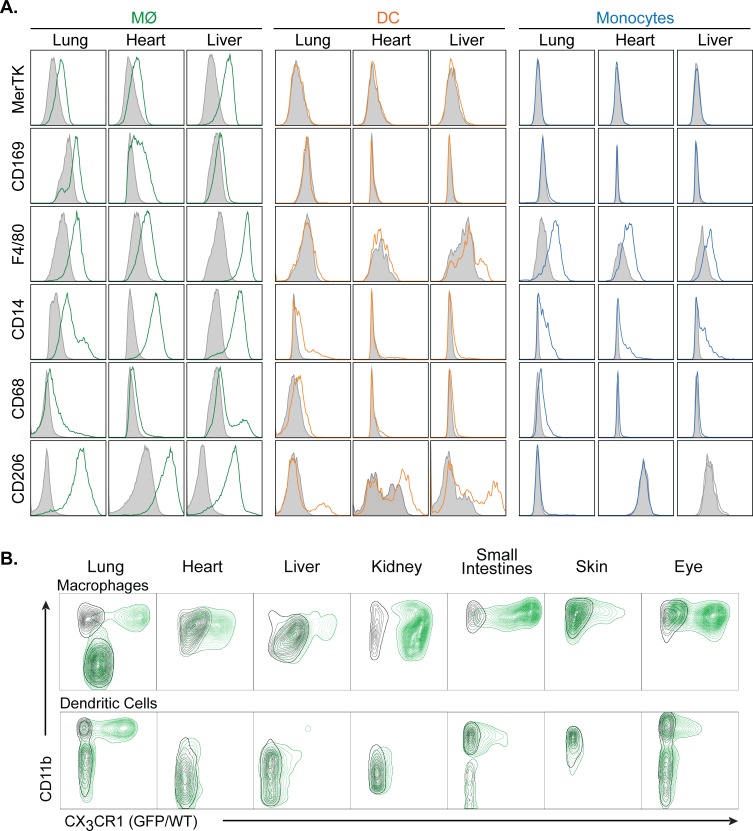
Fig 3. Expression of common myeloid markers on specific cell populations in non-lymphoid tissues.
A. Histograms displaying the expression levels of MerTK, CD169, F4/80, CD14, CD68, and CD206 on macrophages (MФ), dendritic cells (DC), and monocytes in the indicted tissues. Filled grey plots represent isotype controls. All panels are representative of 3 independent experiments. B. Contour plots of CD11b vs. Green Fluorescent Protein expression in macrophages (upper row) and dendritic cells (lower row) in the indicated tissues. Each panel shows cells obtained from wild type mice (black) overlaid with cells obtained from Cx3cr1wt/GFP knock-in mice (green). All panels are representative of 3 independent experiments.

