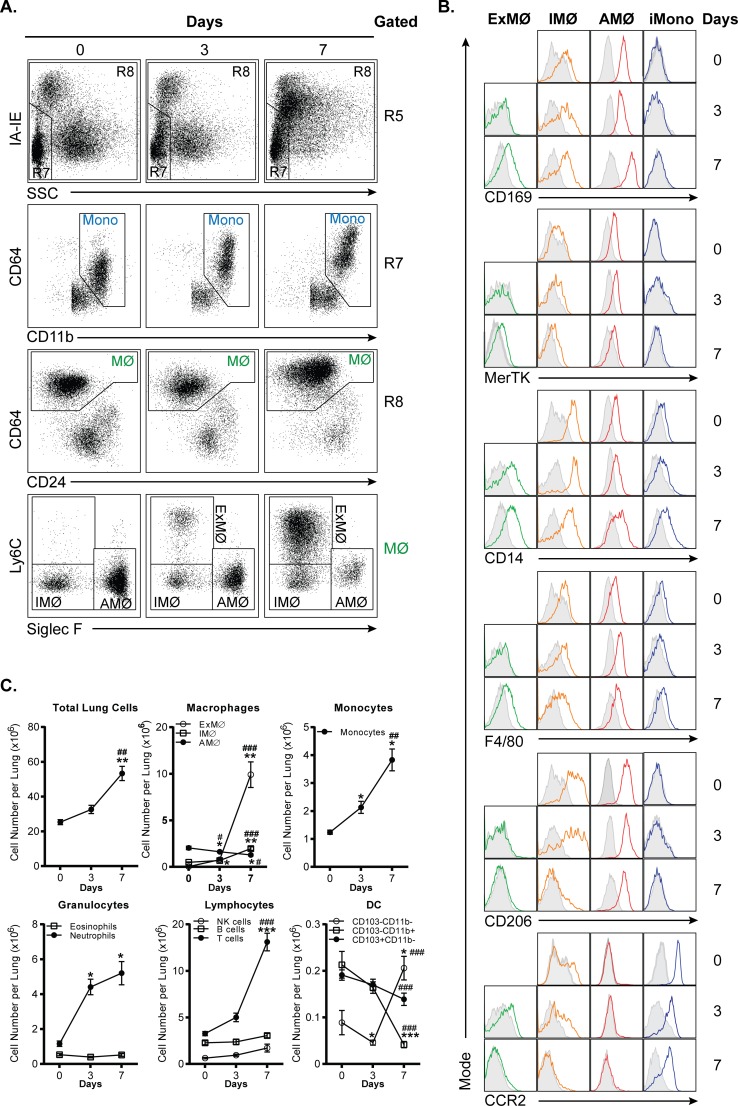
Fig 4. Flow cytometric analysis of H1N1 influenza infected lung tissues.
A. Dot plots showing gating strategy used to identify monocytes and macrophage (MФ) subpopulations in H1N1 influenza infected lung tissues. The gating strategy begins on the top row, which is gated on R5 from Fig 1. B. Histograms depicting CD169, MerTK, CD14, F4/80, CD206, and CCR2 expression on interstitial macrophages (IMФ), exudative macrophages (ExMФ), alveolar macrophages (AMФ), and Ly6Chigh inflammatory monocytes (iMono). C. Line graph depicting immune cell profiles on day 0, 3, and 7 after H1N1 influenza exposure. And, n = 3 for day 0; n = 9 for day 3; and n = 7 for day 7. *p<0.05, **p<0.01, and ***p<0.001, compared to day 0. #p<0.05, ##p<0.01, and ###p<0.001, compared to day 3.

