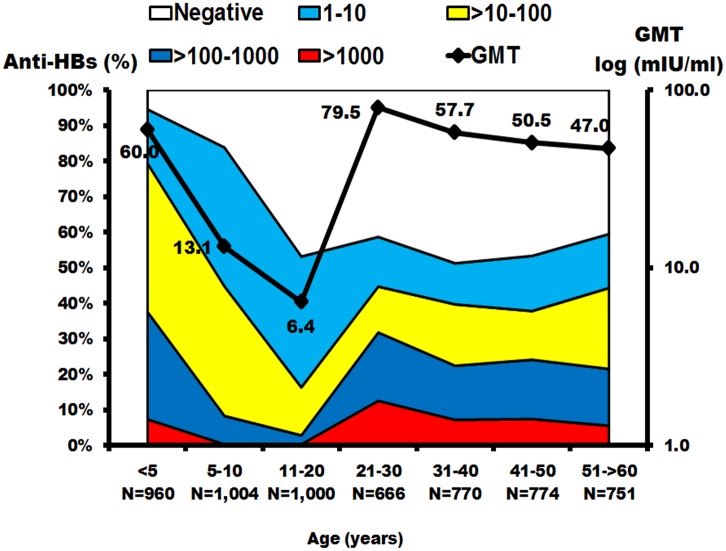
Fig 5. The prevalence of anti-HBs and geometric mean titers (GMTs) in the Thai population.
The x-axis represents the seven age groups and the sample size in each age group. Scale on the left represents the percentage of the population with positive anti-HBs. Scale on the right represents the GMTs in each age group, with the means indicated as black squares. Antibody measurements were negative (white), 1–10 mIU/ml (blue), >10 100 mIU/ml (yellow), >100–1000 mIU/ml (dark blue) and > 1000 mIU/ml (red). GMTs were calculated from anti-HBs > 1 mIU/ml.

