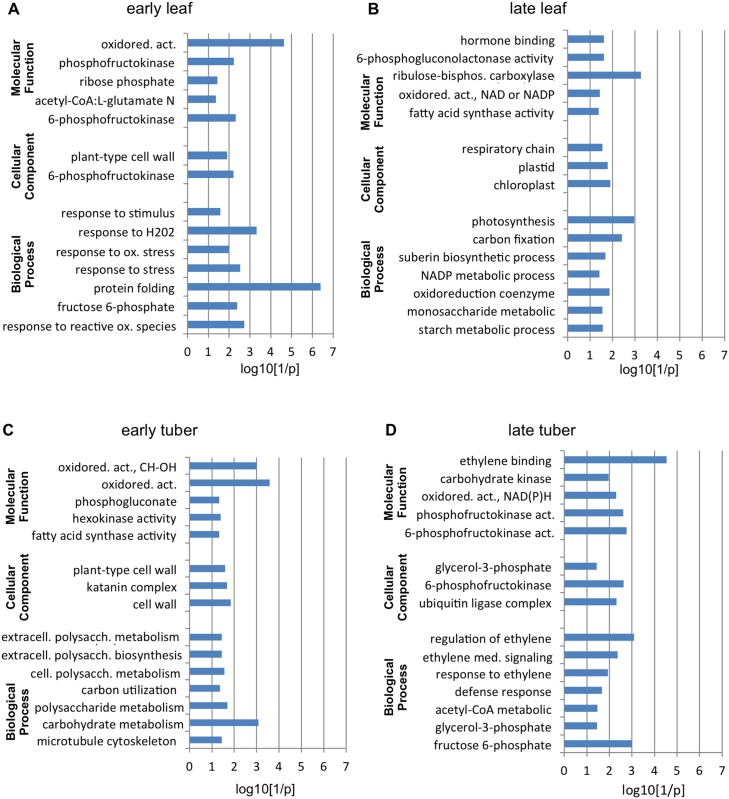
Fig 3. Representation of GO term enrichment.
Selected GO term enrichments are visualized in early (A) and late (B) leaf samples. Figs (C) and (D) show GO term enrichment for early and late tuber samples, respectively. Categories are indicated on Y axis, log10[1/p] is on the X-axis where p is the p-value of the enrichment.

