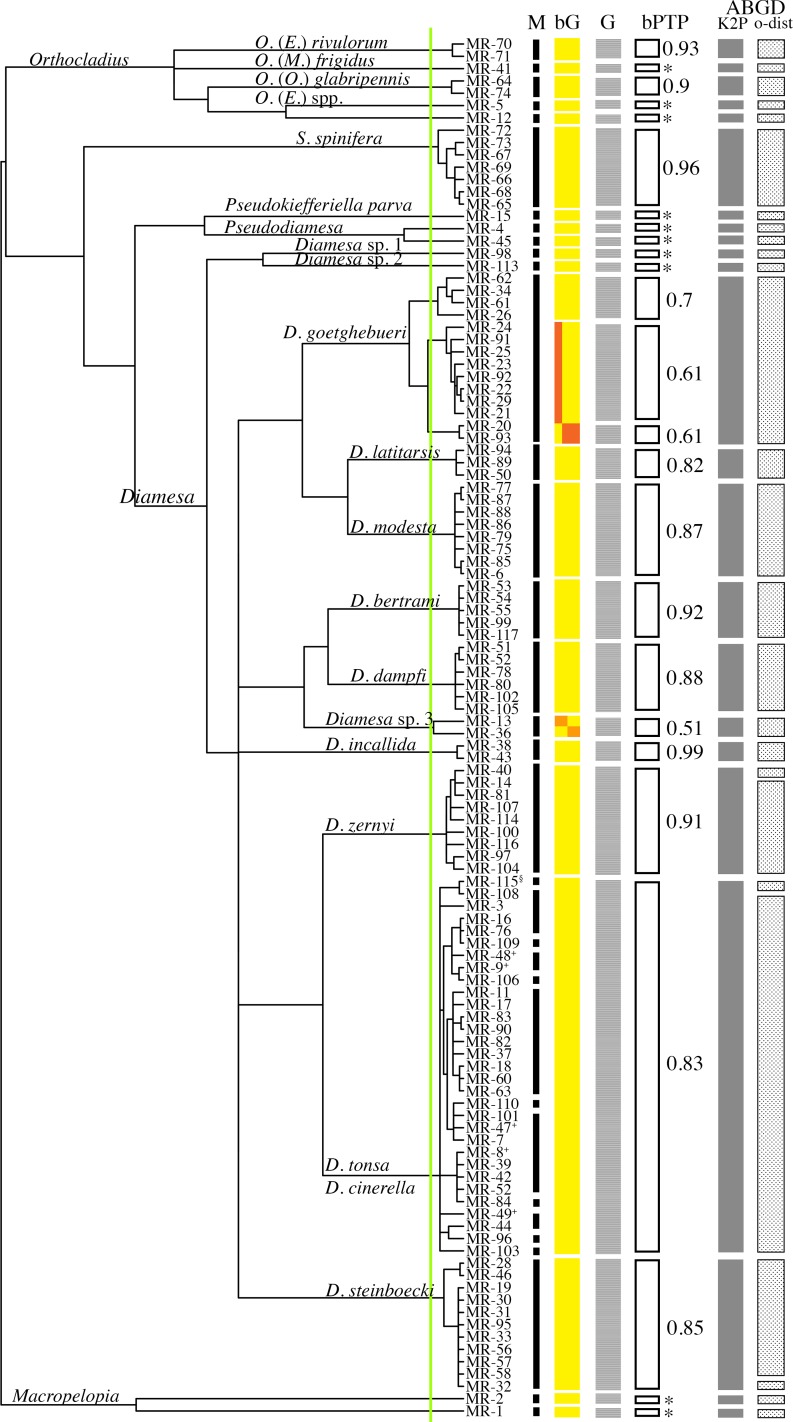
Fig 3. Species delimitation analysis based on cox1 gene sequences.
A Bayesian ultrametric tree inferred from the cox1 gene sequence dataset and used as input for GMYC and bGMYC models. Specimen identifiers are reported on tips (MR as an acronym of the collection identifier plus the id number); §: possible hybrid specimens between D. vaillanti and D. tonsa; +: larvae at third instar. The vertical green line identifies the between/within species GMYC threshold. M: vertical black lines indicating the identified morphospecies. bG: putative species identified by bGMYC are represented by vertical solid colored boxes, colors indicate support values of Bayesian posterior probability (bpp) as follow: 0.05–0.5 in red, 0.5–0.9 in orange and 0.95–1 in yellow. G: vertical solid light-grey boxes represent putative species identified by GMYC. bPTP: black-edged boxes indicate the putative species (corresponding to the maximum likelihood partition) identified by the bPTP approach; values of bpp supporting putative species are reported, * = bpp of 1. Solid dark grey and light grey texture boxes indicate putative species identified by the ABGD approach, respectively implementing K2P and observed pairwise distance.

