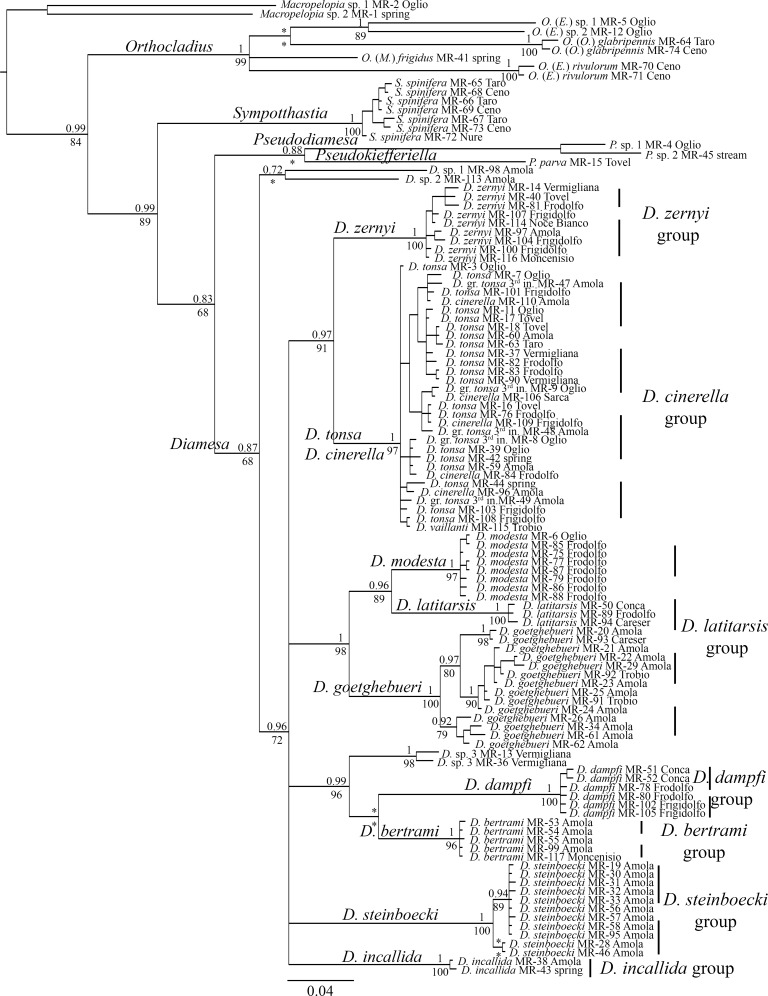
Fig 4. Bayesian consensus tree inferred from an alignment of 112 cox1 gene sequences.
On the nodes of main the lineages the support values are expressed as bpp (above) and aLRT (below); * denotes support values ≤ 0.65 bpp and ≤ 65% aLRT. Vertical dashed lines indicate species groups. The scale bar at the bottom indicates the distance in substitutions per site.

