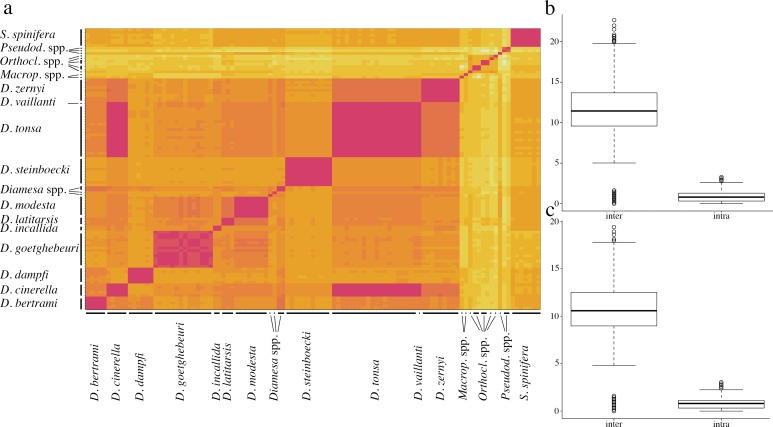
Fig 5. Pairwise Kimura two-parameter nucleotide distance.
a. Heat map of the K2P pairwise distance matrix; values of nucleotide distance are proportional to color intensity, with low and high values of pairwise nucleotide distance indicated respectively by dark and light colors; morphological species are reported on the axis. Box-plot representing intra- and inter-specific K2P (b) and observed (c) pairwise nucleotide distance.

