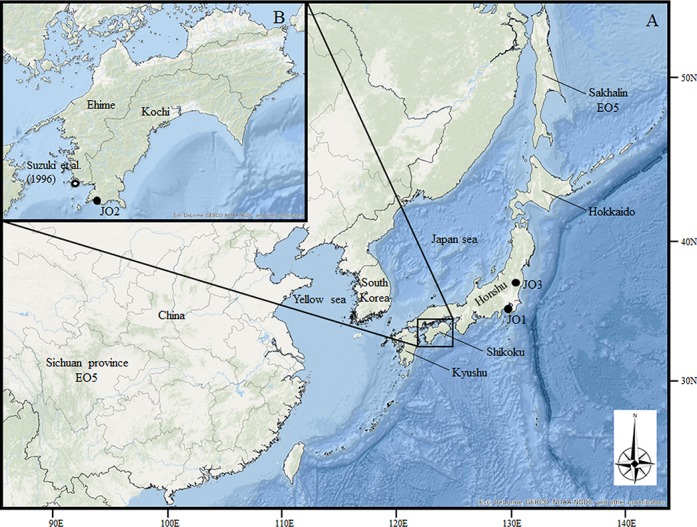
Fig 1. Map showing the locations of Japanese and Eurasian otters.

(A) Map of East Asia. (B) Map of Shikoku Island. The capture locations of the individual Japanese otters used in this study are indicated by filled circles (JO1, JO2, and JO3). The capture location of the individual Japanese otter used by Suzuki et al. [10] is indicated by an open circle. EO indicates the locations from where Eurasian otter samples were obtained (EO3, EO5). Reprinted from PLOS ONE under a CC BY license, with permission from Environmental Systems Research Institute, Inc. (Esri), original copyright 2015.
