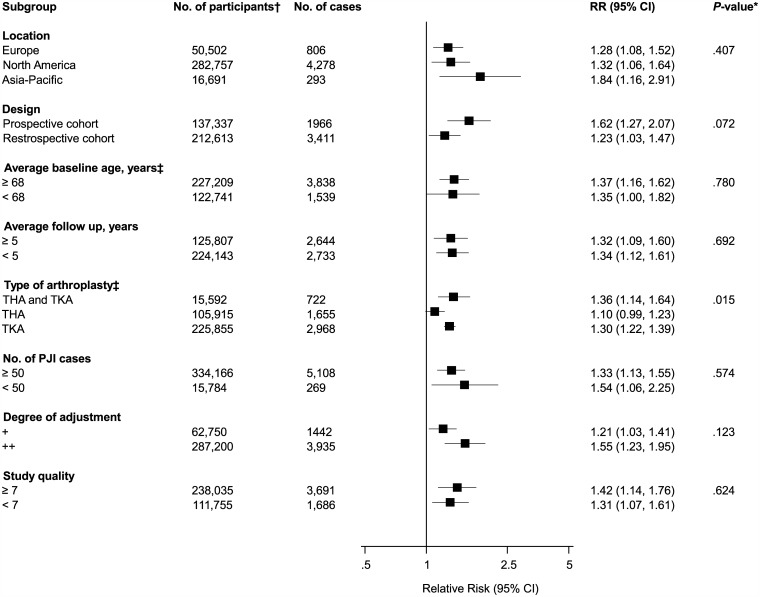
Fig 3. Risk of periprosthetic joint infection comparing males to females, grouped according to several study characteristics.
CI, confidence interval (bars); *, P-value for meta-regression; †, are number of participants or arthroplasties; ‡, number of cases and participants do not add up to total because of missing data; PJI, periprosthetic joint infection; THA, total hip arthroplasty; TKA, total knee arthroplasty.

