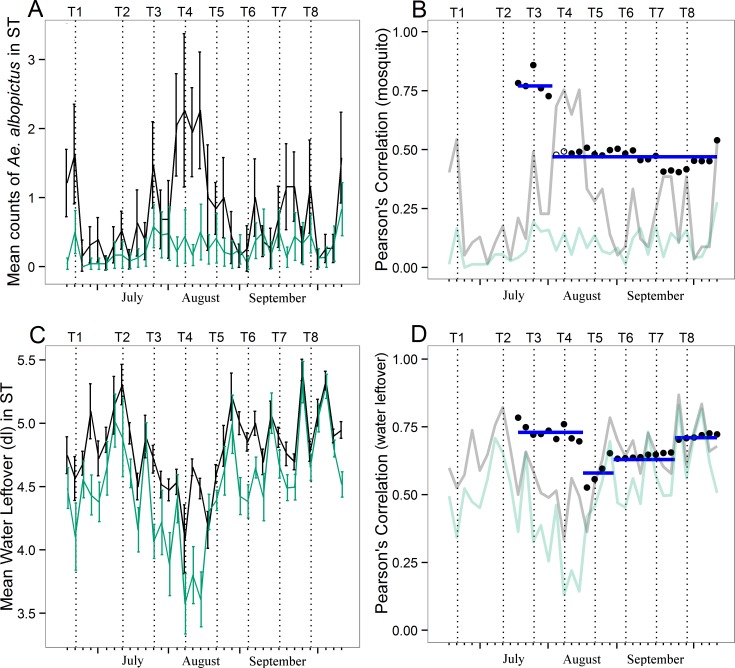
Fig 4. Change point analysis of Aedes albopictus abundance and of water leftover in study sites.
(A) Seasonal pattern of mosquito abundance in insecticide-treated (green line, N = 24) and untreated (black line, N = 19) sites. (B) Correlation of residual of mosquito time series between treated and untreated sites. (C) Seasonal pattern of water leftover in sticky traps in insecticide-treated (green line, N = 24) and untreated (black line, N = 19) sites. (D) Correlation of residual of water leftover time series between treated and untreated sites. Solid circles = significant correlation estimates (p-value < 0.05). Empty circles = non-significant correlation estimates (p-value > 0.05). Blue horizontal line in B and D panels = fitted mean in each sequence; each break identifies a statistically significant change in mean. Vertical bars in A and C panels = 95% confidence intervals. X-axis = 2013 collection dates. Vertical dotted lines = dates of insecticide sprayings.

