Fig. 5.

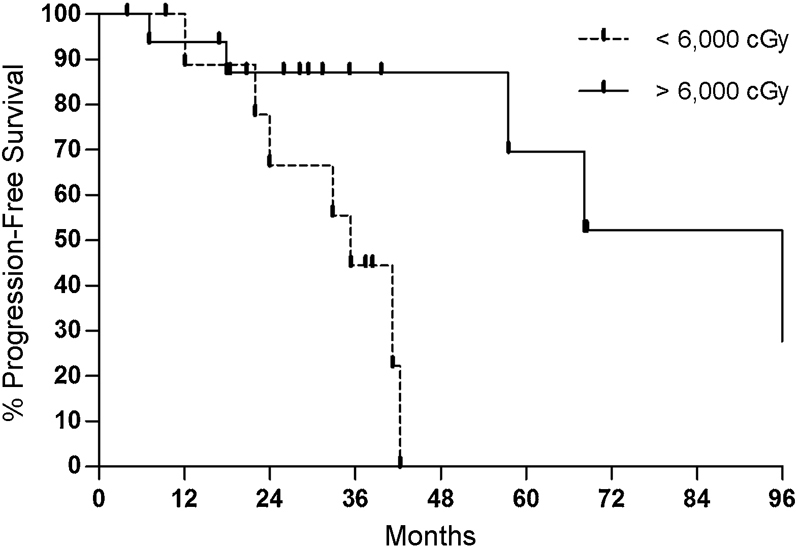
Kaplan–Meier plot comparing rates comparing progression-free survival between high-dose (solid line) and low-dose (dotted line) stereotactic radiation therapy (p = 0.009).

Kaplan–Meier plot comparing rates comparing progression-free survival between high-dose (solid line) and low-dose (dotted line) stereotactic radiation therapy (p = 0.009).