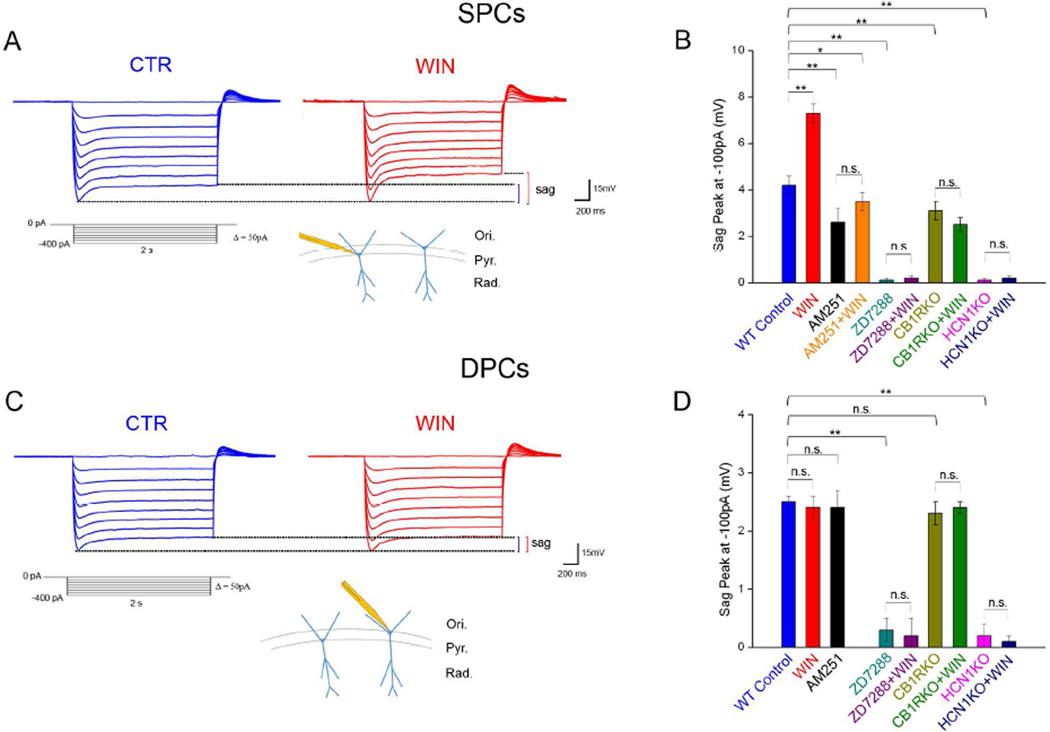
Figure 1. Effects of CB1R modulation on sag in SPCs and DPCs.
A) Top: Examples of sag potentials from an SPC (2 sec pulses, −400pA to 0pA, 50pA steps) before (CTR, blue) and 4 min after WIN application (red). Bottom: Hyperpolarizing step protocol and schematic representation of SPCs in the CA1.
B) Effects of pharmacological and genetic modulation of CB1Rs and/or HCNs on sag amplitude recorded at −100 pA in SPCs (n of cells: WT Control: 11; WIN: 11; AM251: 13; AM251+WIN: 13; ZD7288: 12; ZD7288+WIN: 13; CB1RKO: 13; CB1RKO+WIN: 12; HCN1KO: 12; HCN1KO+WIN: 11; for all current steps, see Table S1).
C) Example of sag potentials a DPC (as in A).
D) Effects of pharmacological and genetic modulation of CB1Rs and/or HCNs on sag amplitude recorded at −100 pA in DPCs (n: WT Control: 13; WIN: 15; AM251: 12; ZD7288: 14; ZD7288+WIN: 12; CB1RKO: 13; CB1RKO+WIN: 13; HCN1KO: 15; HCN1KO+WIN: 15; see Table S2).
Data in this and subsequent figures are represented as mean±standard error (SE); n.s.: not significant; *p<0.05; **p<0.01. Ori: stratum oriens; Pyr: stratum pyramidale; Rad: stratum radiatum.

