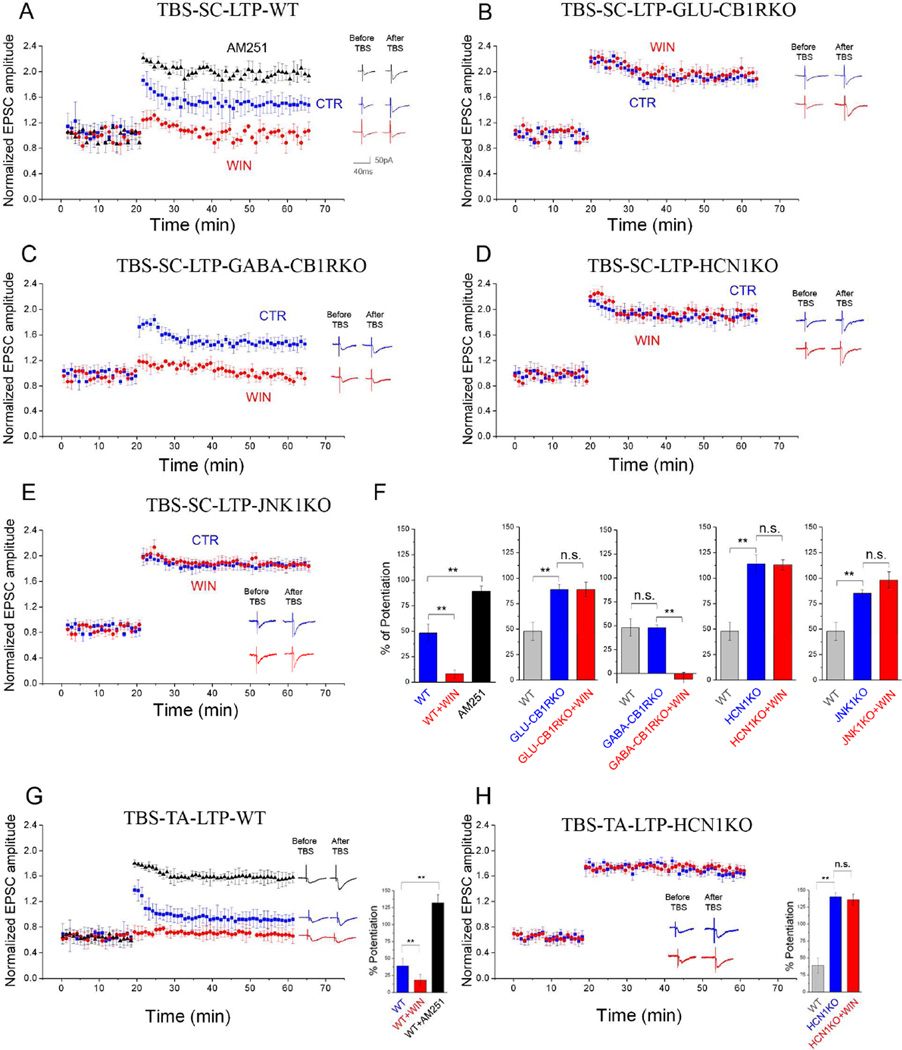
Figure 6. Effects of CB1R-mediated Ih modulation on LTP.
A–E) Summary plots of the normalized EPSC amplitudes from SPCs before and after LTP induced by theta burst stimulation (TBS) at Schaffer collateral (SC) inputs (TBS-SC-LTP) from (A) WT (n=11), (B) GLU-CB1RKO (n=12), (C) GABA-CBARKO (n=14), (D) HCN1KO (n=13), and (E) JNK1KO (n=12), recorded in control perfusate (CTR, blue) or WIN (red) or AM251 (black). Examples traces were acquired 10min before and 60min after TBS.
F) Summary graphs of % potentiation of EPSC amplitudes 60min after TBS compared to 10min before.
G,H) Summary plots (as in A–E) induced by TBS at temporo-ammonic (TA) inputs (TBS-TA-LTP) in SPCs from WT (G) and HCN1KO (H) mice. Right: Bar graphs of % potentiation of EPSCs. G) Responses in CTR, WIN or AM251 (n: CTR: 11; WIN: 15; AM251: 10). H) Responses in CTR or WIN (n: CTR: 10; WIN: 13).

