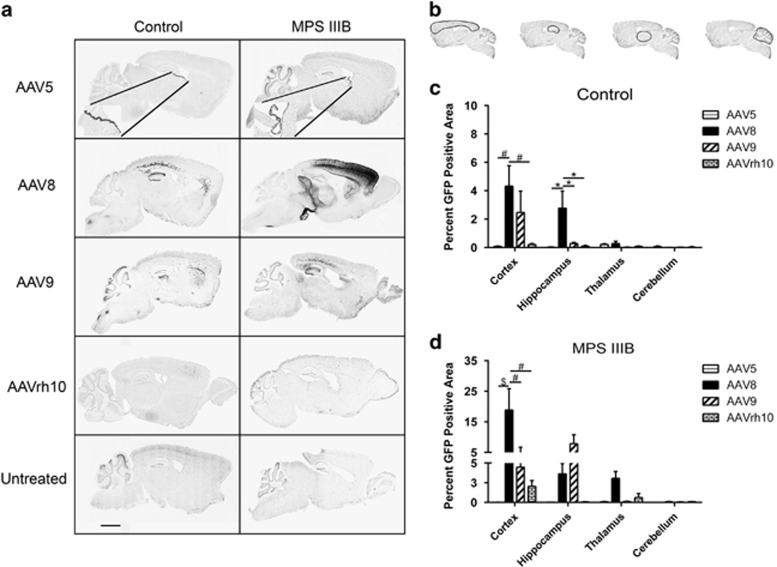
Figure 2.
Mid-sagittal AAV serotype-dependent regional biodistribution. Mid-sagittal brain sections of control and MPS IIIB 3-month-old littermates were assessed for the presence of rAAV-GFP (dark areas, scale bar=2mm). Insets in AAV5 panels reflect transduced ependymal cells at × 20 magnification (a). Percentage area of GFP expression was assessed in the cortex, hippocampus, thalamus and cerebellum, outlined in (b) respectively of control (c) and MPS IIIB animals (d). All sagittal sections were scanned at × 20 magnification, and GFP expression was quantified using Aperio ImageScope algorythm. Two-way ANOVA was used to assess differences within each region based on serotype, and one-way ANOVA was used to test individual differences between serotype, n=3–6/cohort, *P<0.05, #P<0.001, $P<0.0001. Data represented as mean±s.e.m.

