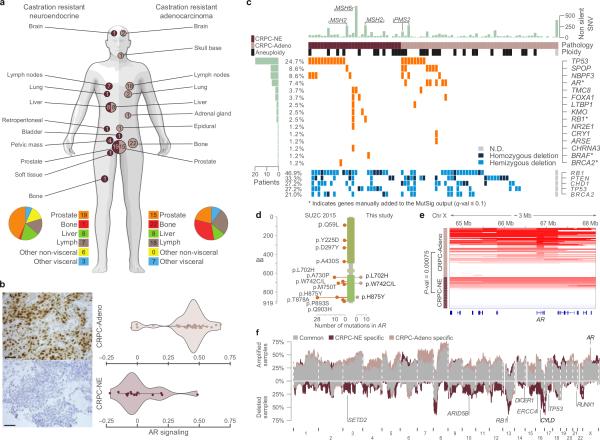
Figure 1. Clinical and mutational profile of the cohort.
(a) Schematic illustrating sites of biopsy for CRPC-NE (dark pink) and CRPC-Adeno (light pink) subgroups. Numbers in circles indicate numerosity of samples from each site. (b) AR signaling (right) based on abundance of mRNA transcripts included in the AR signaling signature described in ref 19. Violin plots show the density of AR signaling. Each dot represents a sample; diamonds and solid lines represent the mean and 95% confidence interval, respectively. Representative immunohistochemistry (left) shows AR protein expression. Scale bars, 50 μm. (c) Significantly mutated genes. Each row represents a gene and each column an individual subject. Top light green bars correspond to the total number of non-silent SNVs in an individual. Left light green bars indicate the number of subjects harboring non silent corresponding mutations in the genes indicated on the right. Bottom panel reports the copy number status of selected genes. (d) Genomic location of AR mutations in samples from SU2C-2015 and this study. (e) Copy number status of AR locus. Color intensity and location are indicative of level and focality of amplification. (f) Frequency of copy number aberrations; concordant fractions (gray), CRPC-NE specific (dark pink) and CRPC-Adeno specific (light pink). Data adjusted for tumor ploidy and purity. Highlighted genes are significantly preferentially aberrant in one class and demonstrate concordant differential mRNA levels (for DNA and mRNA: FDR <= 10% for deletions and p-value <= 1% for amplifications).

