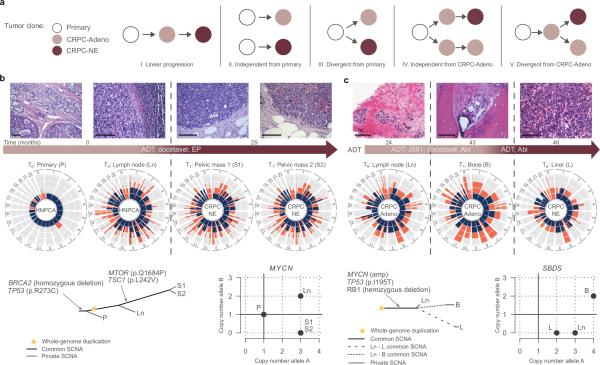
Figure 2. Tracing CRPC-NE emergence through allele specific analysis.
(a) Potential models of evolution that occur during prostate cancer progression towards the neuroendocrine phenotype: linear progression from primary untreated adenocarcinoma to CRPC-Adeno to CRPC-NE; independent progression of two distinct clonal populations within the primary or metastatic CRPC-Adeno towards either CRPC-Adeno or CRPC-NE; divergent clonal evolution of CRPC-NE from either primary adenocarcinoma or CRPC-Adeno. *indicates favored model. (b) Allele specific analysis of primary prostate adenocarcinoma and local lymph node metastasis removed at time of radical prostatectomy (RP) and two metastatic CRPC-NE (treated) tumors (3 years after RP) from subject WCMC7520. H&E pathology images and intervening therapies are shown in the timeline. Scale bars, 100 μm. (c) Allele specific analysis of tumors at three time points from patient subject WCMC161 during castration resistance: lymph node (CRPC-Adeno), bone biopsy (CRPC-Adeno), and liver biopsy (small cell CRPC-NE). H&E pathology images and intervening therapies are shown in the timeline. ADT= androgen deprivation therapy; EP= etoposide and cisplatin chemotherapy; Abi= abiraterone acetate with prednisone. Circos plots summarize genome-wide allele specific DNA quantity in tumor cells. Individual's tumor phylogeny sketched upon allele-specific analysis including genome-wide amplification and ploidy assessment. Scale bars, 100 μm.

