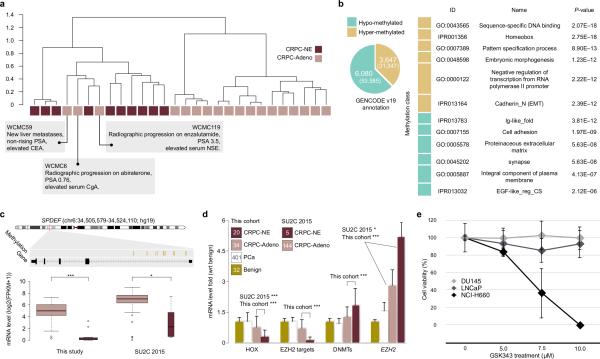
Figure 3. Methylation analysis of CRPC-NE and CRPC-Adeno.
(a) Hierarchical clustering of 28 eRRBS samples data using (1 - Pearson's correlation) as distance measure on unselected sites. Clinical features of outlier cases are described. (b) Left, pie chart showing the number of differentially methylated genes, identified by annotating hyper- and hypo- methylated loci (number is reported between parentheses) on GENCODE version 19. Right, table shows a selection of terms enriched by differentially methylated genes. (c) Top, genome track of SPDEF. Hyper-methylated loci are reported in the annotation track. Bottom, box plot of expression levels of SPDEF samples for This Study (left) and SU2C/PCF 2015 (right) cohorts. (d) Bar plots highlight the effect of EZH2 transcription activity across 487 samples with different pathology classification. The bars are relative to the mRNA level fold (with respect to benign prostate tissue samples) of homeobox genes under-expressed in CRPC-NE versus CRPC-Adeno (FDR < 0.1); a selection of EZH2 target genes (DKK1, NKD1, AMD1, HOXA13, HOXA11, NKX3-1); DNA methyltransferase genes - indicated as DNMTs (DNMT1, DNMT3B, DNMT3A, DNMT3L); EZH2. Significance of differences between CRPC-NE and CRPC-Adeno subgroups are shown (max P = 3*10−5 for DNMTs). When significant, p-values in SU2C/PCF cohort are shown. The number of samples for each pathology classification is reported inside the square symbols of the legend. (e) Cell viability in prostate adenocarcinoma cell lines (DU145, LNCaP) the neuroendocrine prostate cell line NCI-H660 assessed at 48 hours after treatment with escalating does of the EZH2 inhibitor GSK343 (5, 7.5, 10uM).

