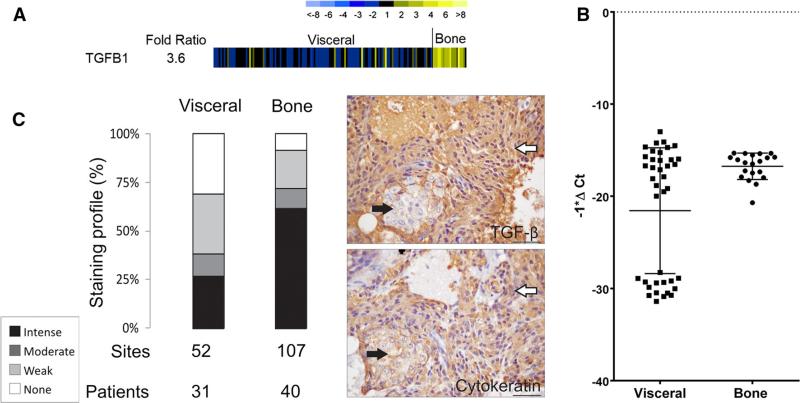
Fig. 1.
a Agilent™ oligo array expression analysis of TGFB1 in CRPC metastases. There was a 3.6 fold difference in mean-centered ratios between visceral metastases versus bone metastases. Yellow indicates higher expression and blue lower expression. b Realtime PCR for TGFB1 between visceral metastases versus bone metastases. TGFB1 was higher in bone metastases (p = 0.003). c Cytoplasmic TGFβ expression is significantly higher in bone metastases than visceral metastases (p < 0.001). Staining intensities (intense, moderate, weak, or no staining) are described in the inset. Patients—represents the number of patients represented, sites—represents the number of metastases. To highlight the epithelial phenotype, images of serial sections of a bone metastasis stained for TGFβ and Pan-cytokeratin are shown to the right. White arrows highlight epithelial cells with elongated nuclei and the black arrows highlight cells with round nuclei. Bar = 40 microns. (Color figure online)

