Figure 6.
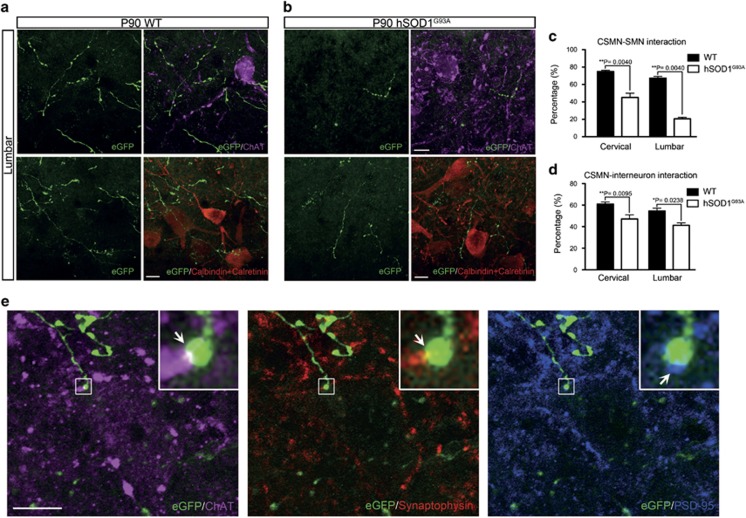
CSMN–SMN interaction is significantly reduced in hSOD1G93A mice. (a) Representative image of AAV2-2 CBA-transduced lumbar axons interacting with interneurons (Calbindin+/calretinin+) and SMN (ChAT+) in WT mice. (b) Representative image of AAV2-2 CBA-transduced lumbar axons interacting with interneurons (Calbindin+/calretinin+) and SMN (ChAT+) in hSOD1G93A mice. (c) Bar graph represents mean percentage ±s.e.m. of SMN interacting or in close proximity with eGFP+ CST axons in WT and hSOD1G93A in the cervical and lumbar spinal cord. (d) Bar graph represents mean percentage ±s.e.m. of interneurons interacting or in close proximity with eGFP+ CST axons in WT and hSOD1G93A in the cervical and lumbar spinal cord. (e) Representative image of direct synaptic contact between CST (eGFP+ axon) and SMN (ChAT+, purple). Axon colocalizes with presynaptic marker synaptophysin (red), and it is juxtapose to postsynaptic marker PSD-95 (blue). Mann–Whitney test, *P<0.05, **P<0.01. Scale bar=10 μm.

