Fig. 2.

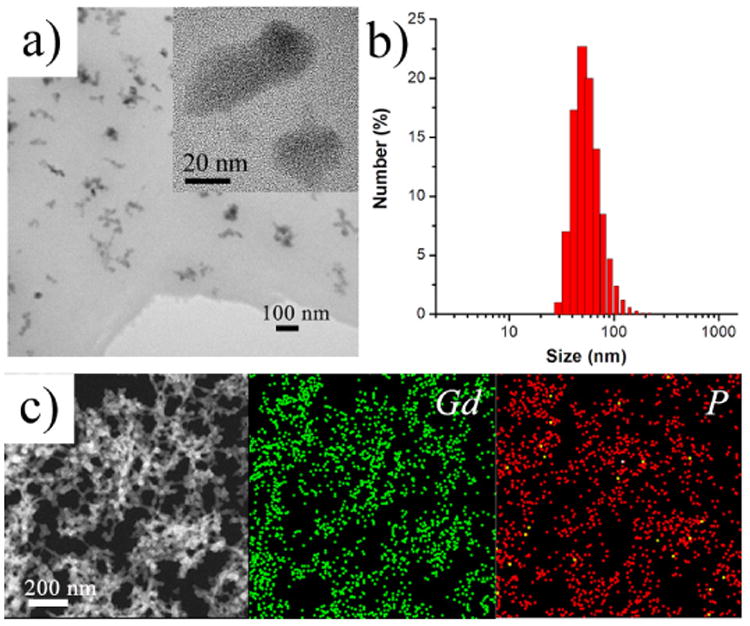
Structural and compositional characterization of SNPs. a) TEM image (Inset: high resolution image) and b) size distribution of SNPs. c) HAADF-STEM image of SNPs and corresponding EDX elemental maps (Gd (green) and P (red)).

Structural and compositional characterization of SNPs. a) TEM image (Inset: high resolution image) and b) size distribution of SNPs. c) HAADF-STEM image of SNPs and corresponding EDX elemental maps (Gd (green) and P (red)).