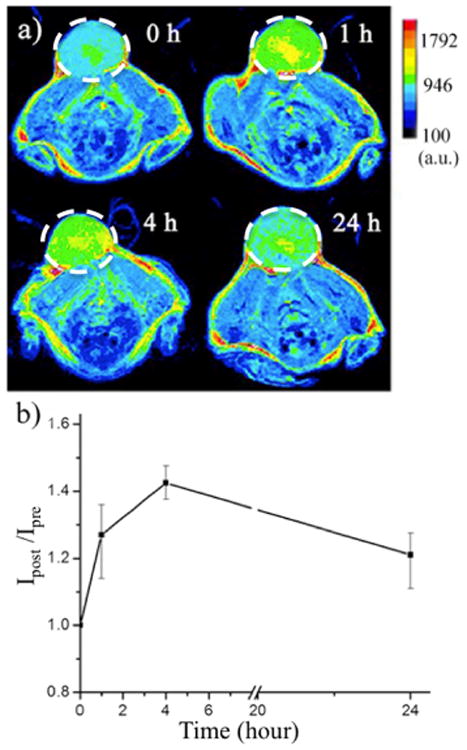
Fig. 4.

MRI of MDA-MB-231 tumor in vivo. a) In vivo T1-weighted MR images (color-coded by intensity) acquired before and at different time points after i.v. injection of SNPs in MDA-MB-231 tumor-bearing mice. Tumors are indicated by white dashed circles. b) Enhancement of the MRI signal intensity of the tumor sites after injection of SNPs (derived from the quantification of the data in panel (a)). (Ipre = intensity at time = 0, before injection, Ipost = intensity at time points thereafter. Data are medians ± quartiles (N=5).
