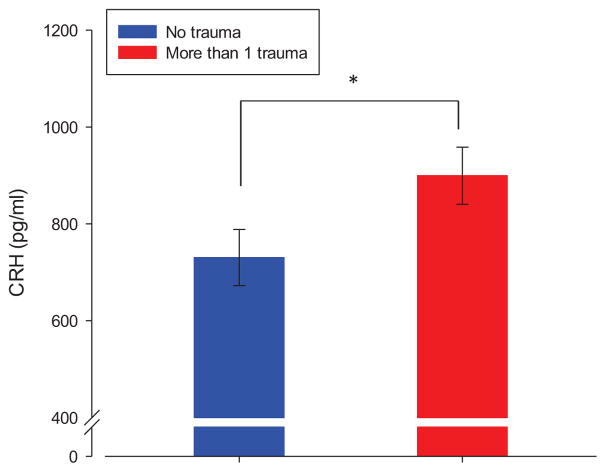
Figure 1.
Scatterplot depicting the relationship between maternal childhood trauma and placental CRH over the course of gestation. The black square represents the point of inflection at 19 weeks of gestation. Analyses were performed using the continuous total CT variable as predictor and logCRH as outcome and including all covariates. For illustration purposes the difference in non-logarithmized CRH values between the two groups representing no trauma exposure and exposure to more than one trauma are presented in the figure.

