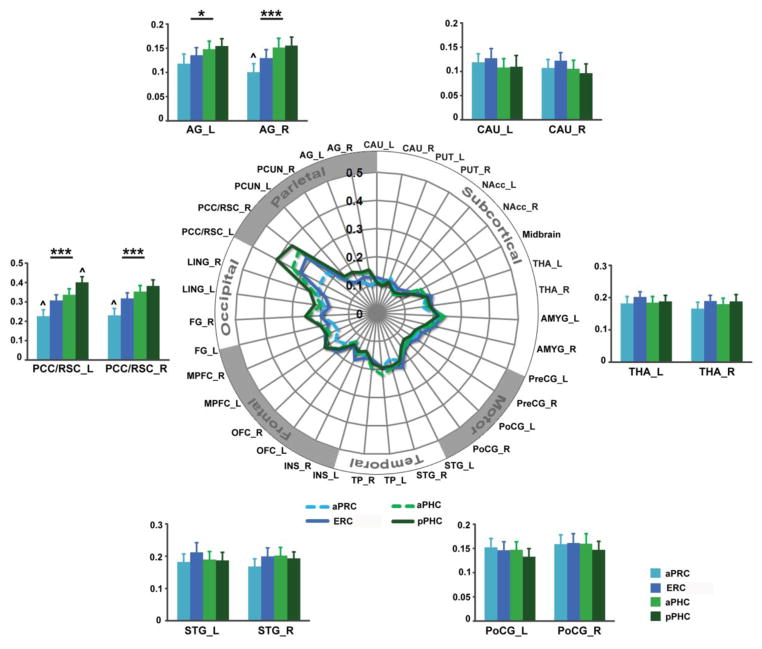
Figure 7. Functional connectivity gradients of four distinct PHG nodes.
(A) Schematic polar plot illustrating connectivity patterns of the parahippocampal seeds with target ROIs. The concentric circles depict the parameter estimates (β), which represent the strength of seed connectivity with target ROIs. (B) Bar graphs show mean parameter estimates (β) of aPRC, ERC, aPHC and pPHC connectivity with representative target ROIs. Error bars denote SEM. Notes: All abbreviations are same as Figure 4. Notes p < 0.05; ** p < 0.01; *** p < 0.001. ^, significantly from every other seed. Notes: PCC/RSC, posterior cingulate cortex/retrosplenial cortex; STG, superior temporal gyrus; PoCG, postcentral gyrus; THA, thalamus; CAU, caudate; AG, angular gyrus; R, right; L, left.

