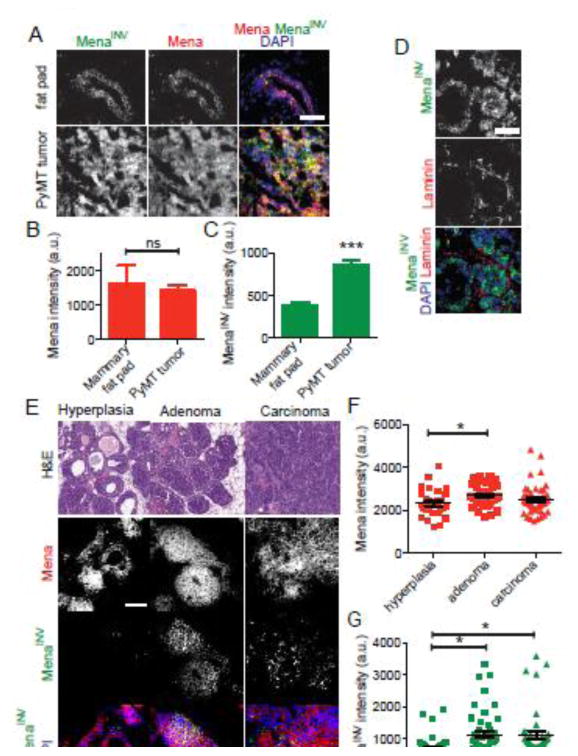
Figure 2. MenaINV expression increases during tumor progression.
A) Representative images of FFPE sections from a normal mammary fat pad tissue from an adult mouse and an advanced MMTV-PYMT tumor stained for Mena, MenaINV and DAPI. Scale bar is 30 μm. Quantification of Mena (B) and MenaINV (C) staining intensity in mammary fat pad vs. advanced tumor. (D) Representative images of FFPE sections from an MMTV-PYMT tumor stained for MenaINV, the basement member laminin and DAPI. Scale bar is 30 μm. E) Representative images of areas from MMTV-PyMT tumor sections depicting hyperplasia, adenoma and carcinoma tumor. H&E image depicts histology of area chosen for for Mena, MenaINV and DAPI staining. Scale bar is 100 μm for H&E image, and 30 μm for fluorescent images. Quantification of Mena (F) and MenaINV (G) staining intensity in different areas of PyMT tumors. Data pooled from 4 tumors, with at least 4 fields of view per sample. Each dot represents a field of view. Asterisk indicates significant difference by t-test (*p< 0.05).

