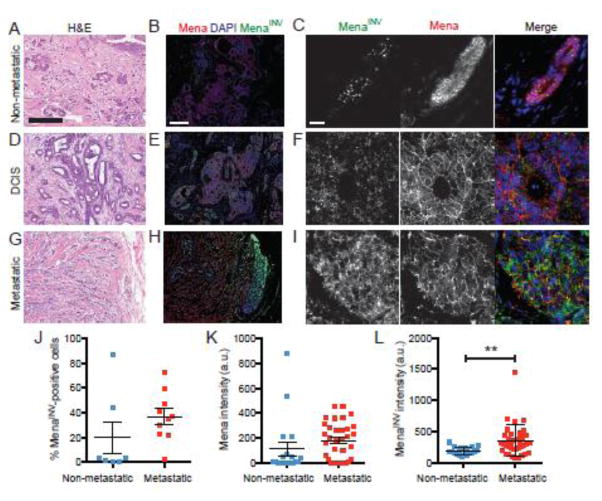
Figure 3. MenaINV expression patterns in human breast cancer.
Representative images of human breast tumor FFPE sections with H&E staining (A,D,G), low (B,E,H) and high (C,F,I) magnification images of immunofluorescence staining for for Mena (red) and MenaINV (green). Images are from a non-metastatic (A,B,C), DCIS (D,E,F) and metastatic tumor (G,H,I). Scale bar for A,D,G is 300 μm, for B,E,H is 100 μm and 30 μm for C,F,I. (J) Quantification of the percentage of total cells (as counted by DAPI staining) expressing MenaINV within a 40X field. Quantification of Mena (K) and MenaINV (L) staining intensity in non-metastatic and metastatic human tumor samples. Data pooled for 3 metastatic and 3 non-metastatic samples, with at least 3 fields of view per sample. Each dot represents a field of view. Asterisk indicates significant difference by t-test (**p< 0.01).

