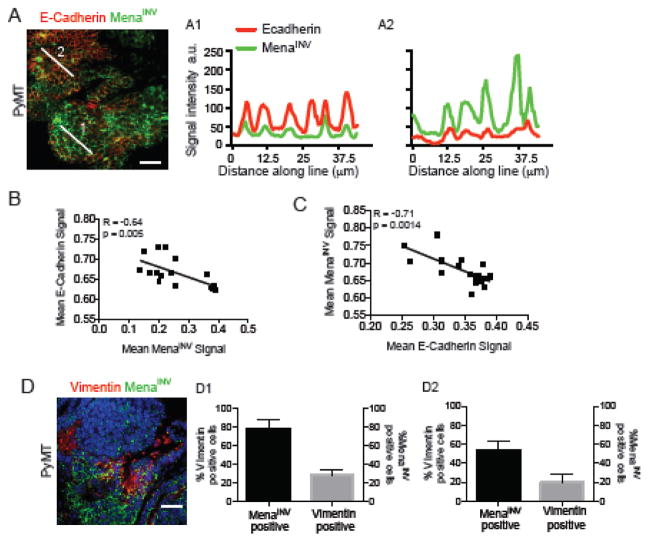
Figure 5. MenaINV expression and EMT markers.
(A) MMV-PyMT tissue section stained for MenaINV (green) and the epithelial marker ECadherin (green). (B1-2) Intensity of MenaINV and ECadherin signal along two lines shown in panel A. (B) Mean fluorescence signal intensity plotted for MenaINV intensity > 0.55 and E-Cadherin intensity < 0.5. (C) Mean fluorescence signal intensity plotted for E-Cadherin intensity > 0.55 and MenaINV intensity < 0.5. Raw pixel values were normalized by the range of intensities in each image. n = 5 mice, 3 image fields per tumor. (D) MMTV-PyMT tissue section stained for MenaINV (red) and vimentin (green). (D1) Black bar quantifies the fraction of vimentin-positive cells that are also MenaINV-positive, grey bar quantifies the fraction of MenaINV-positive cells that are also vimentin-positive. Results are shown as mean +/- SEM = 2 mice, 5–7 image fields per tumor for F and G. Scale bar = 20 μm for F and G. (D2) Black bar quantifies the fraction of vimentin+ cells that are also MenaINV+ in human sections, grey bar quantifies the fraction of MenaINV-positive cells that are also vimentin+. Results are shown as mean +/- SEM, n = 2, 5–7 image fields per tumor for F and G.

