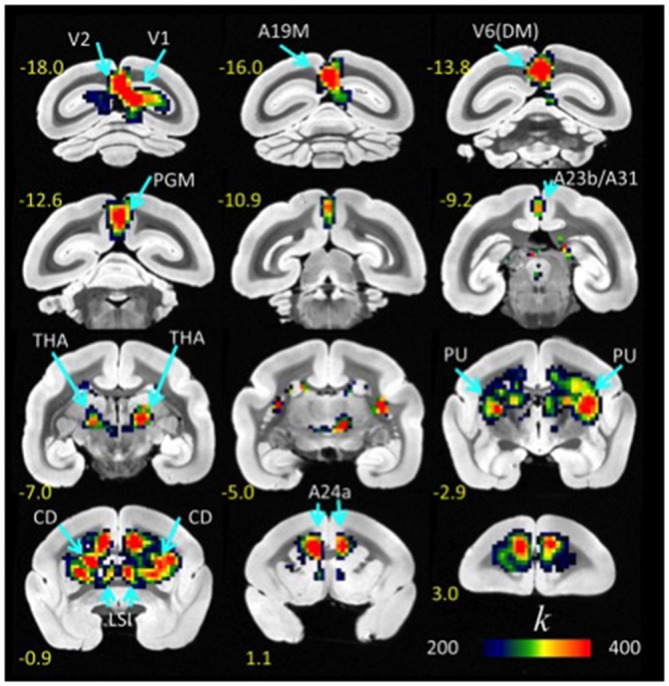
Figure 1.

Average lFCD distribution. Spatial distribution of the lFCD superimposed on coronal T2 MRI views of the marmoset brain. The most prominent lFCD hubs were located in V1 and V2, the primary and secondary visual areas; A19M, the medial part of cortical area 19; V6(DM), the dorsomedial part (DM) of visual area 6 (V6); PGM, the medial part of parietal area; PG, posterior cingulate areas A23b and A31; THA, thalamus; PU, putamen and CD, caudate; LSI, the intermediate part of the lateral septal nucleus; and cingulate area A24a. These maps reflect the average number of functional connections per voxel (k) across 10 awake marmosets. Yellow numbers indicate the distance in mm from the anterior commissure (AC).
