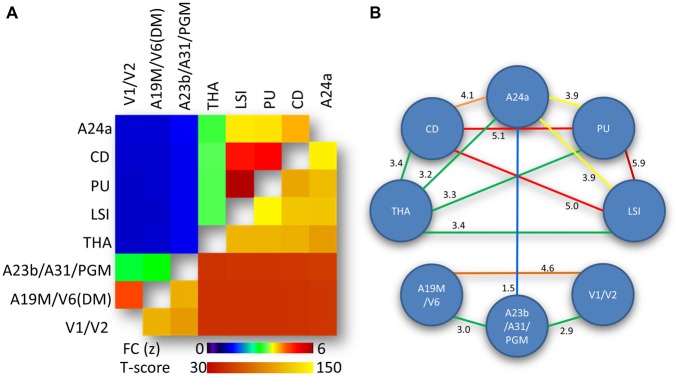
Figure 4.
Network-network interactions. (A) Average correlation matrix (superior-left triangle of the symmetric correlation matrix) reflecting the FC between average time courses from the eight hub-specific networks in Figure 2 and the corresponding statistical significance (inferior-right triangle of the symmetric statistical matrix). Statistical model: within-subjects ANOVA. (B) Diagram highlighting predominant (yellow-red) and moderated (green-blue) interactions between hub-specific networks. Weak network-network interactions (FC < 1.5) are not shown. Numbers quantify the strength of the FC between the networks.

