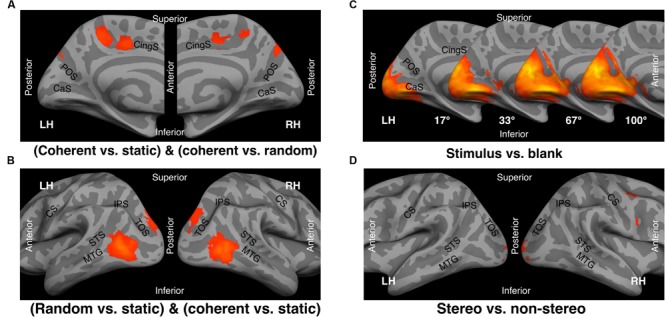
FIGURE 4.

Average t-statistical maps (13 subjects) displayed on the inflated averaged cortical surface. Statistically significant clusters of contiguous activation were identified by SPM analysis (height thresholds: uncorrected p < 0.001 at peak level, p < 0.05 FDR-corrected at cluster level). (A) Coherent motion selective response (conjunction of coherent vs. static and coherent vs. random motion). (B) General motion-induced response (conjunction of random motion vs. static and coherent motion vs. static). (C) Stimulus induced response (stimulus vs. blank) for each of the four stimulus sizes. (D) Stereo-induced response (stereo vs. non-stereo). CaS, calcarine sulcus; POS, parieto-occipital sulcus; CingS, cingulate sulcus; CS, central sulcus; STS, superior temporal sulcus; MTG, middle temporal gyrus; IPS, intraparietal sulcus; TOS, transverse occipital sulcus; LH, left hemisphere; RH, right hemisphere.
