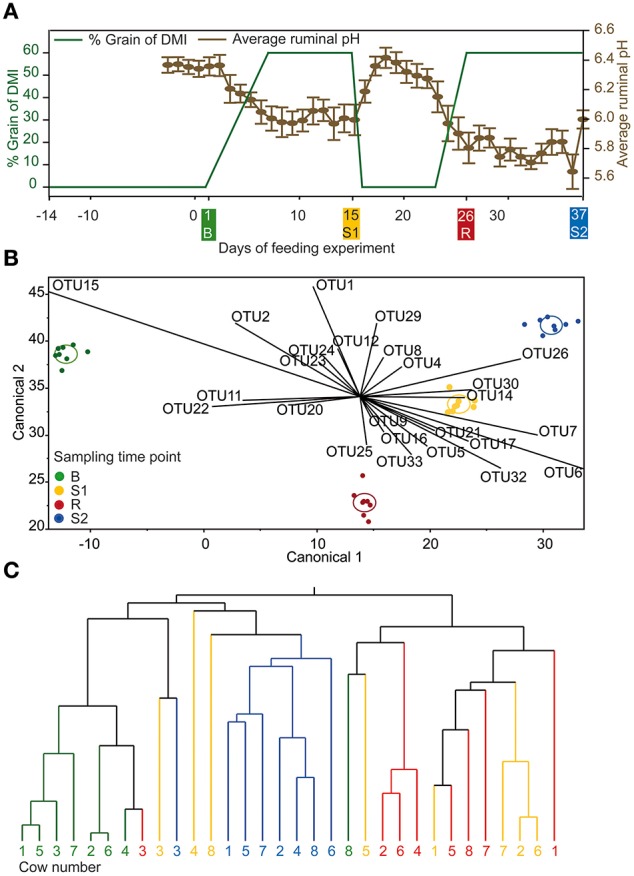
Figure 1.

(A) Experimental design for the feeding experiment illustrated in green and daily mean ruminal pH illustrated in brown (±standard error). Sampling time points B (baseline), S1 (SARA 1), CB (challenge break), and S2 (SARA 2) are marked in same color in all panels. (B) Linear discriminant analysis with OTUs detected in every sampling time point displayed as canonical diagram (n = 270). (C) Hierarchic dendrogram with OTUs detected in every sampling time point (n = 270; method = ward).
