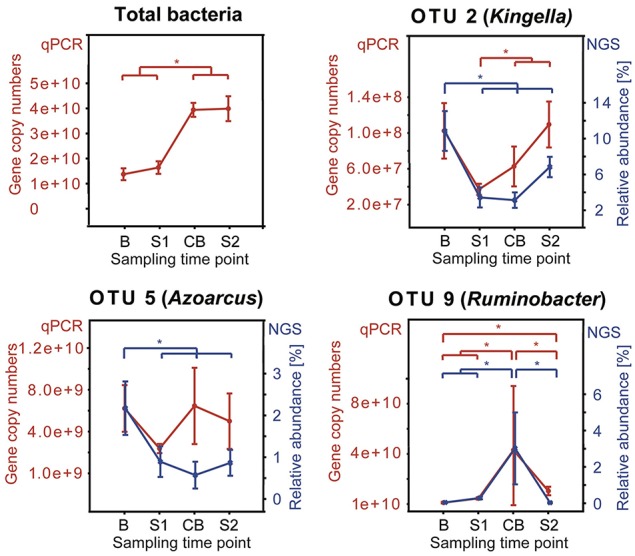
Figure 7.

Comparison between qPCR results and sequencing data (NGS) for OTUs showing relative abundance >1% and significant shifts during the feeding experiment. Median of each sampling time point is shown with standard error. qPCR results are shown as copy numbers per gram rumen papillae in red and NGS results are shown as relative abundance in blue. Sampling time points are as follows: B (baseline), S1 (SARA 1), CB (challenge break), and S2 (SARA 2). An asterisk indicates a significant shift.
