FIGURE 6.

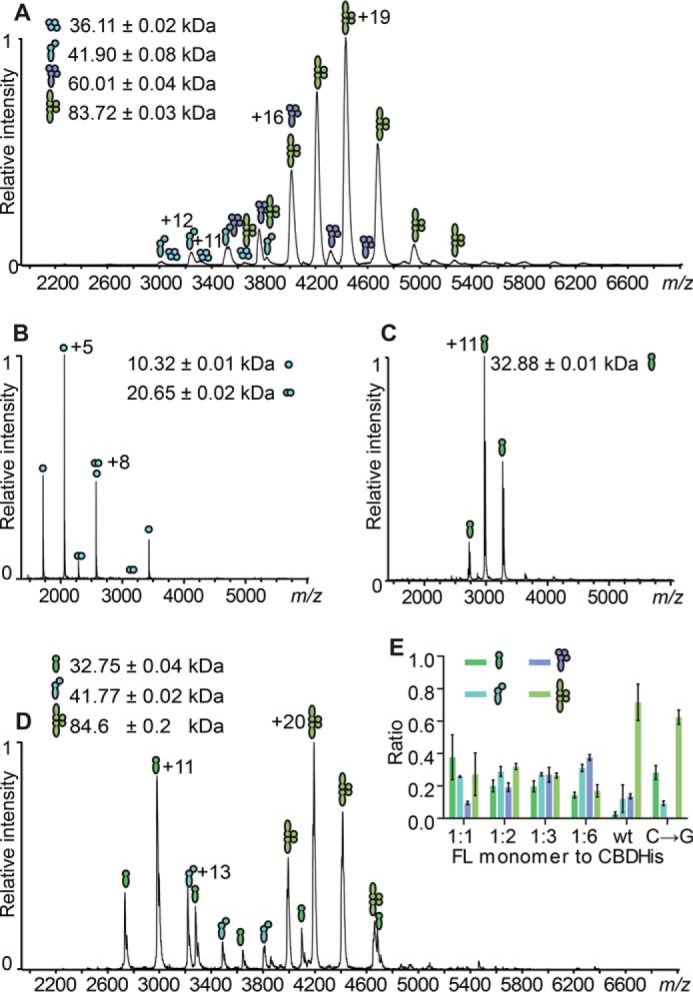
A, ESI-MS analysis of wild type CTP1L. Indicated are the charge state distributions of different complexes formed by the non-covalent association of the CBD with the full-length CTP1L in the native state. Indicated are symbols representing the various complexes formed: CBD tetramer, CBD/FLCTP1L heterodimer, 1:3 FLCTP1L/CBD heterotetramer, and 2:2 FLCTP1L/CBD heterotetramer. CBD is represented by filled circles, and the full-length (FL) protein is shown by filled juggling clubs. B, ESI-MS spectrum of the CTP1L CBDHis construct showing mostly monomers (10.32 kDa) and some dimers (20.65 kDa). C, ESI-MS spectrum of the CTP1L RBSKO mutant, which knocks out the internal ribosomal binding site, showing exclusively monomers. D, ESI-MS analysis of the knock-in silent mutant C → G for the ribosomal binding site of CTP1L, showing the presence of heterodimers and heterotetramers. E, the inset shows bar graphs of the relative abundance of reformed complexes containing RBSKO CTP1L mutant species at equimolar (1:1), 1:2, 1:3, and 1:6 molar excess of CTP1L CBDHis compared with the complexes formed of the CTP1L WT, determined from simulations of the raw data using Massign (from left to right: FL monomer, heterodimer, 1:3 heterotetramer, and 2:2 heterotetramer; CBDHis-only complexes are excluded for clarity). Error bars, S.D.
