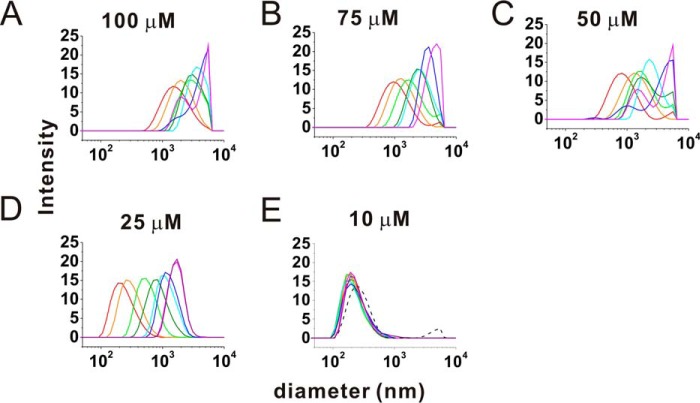
FIGURE 2.
Dynamic light scattering of (GA)15 aggregation at different incubation times. Dynamic light scattering was used to monitor the particle size distribution during (GA)15 aggregation. A and B, for 100 μm (A) and 75 μm (GA)15 (B), signals colored red, orange, green, olive, cyan, blue, and magenta represent 0, 2.5, 10, 15, 20, 30, and 40 min of incubation, respectively. C, for 50 μm (GA)15, signals colored red, orange, green, olive, cyan, blue, and magenta represent 0, 2.5, 15, 25, 30, 40, and 60 min of incubation, respectively. D and E, for 25 μm (D) and 10 μm (E) of (GA)15, signals colored red, orange, green, olive, cyan, blue, magenta, and purple represent 0, 2.5, 10, 30, 50, 75, 110, and 140 min of incubation, respectively. The buffer peak is indicated as a black dashed line in E.

