
FIGURE 5.
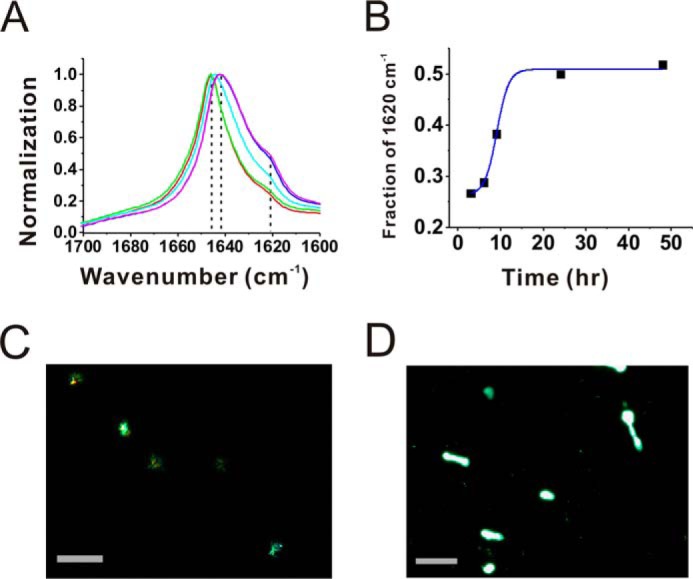
FTIR spectra and amyloid dye staining of GA peptides. A, FTIR spectra of aggregates formed from (GA)15 DPR after 3 (red), 6 (green), 9 (cyan), 24 (blue), and 48 (magenta) h of incubation. The background was subtracted. The peak positions are indicated. B, the relative intensities of 1620 cm−1 from A were plotted against the incubation time. The solid line is a trace line of the data. C and D, images of Congo red birefringence (C) and ThT (D) under fluorescence microscopy. Scale bars = 100 μm.