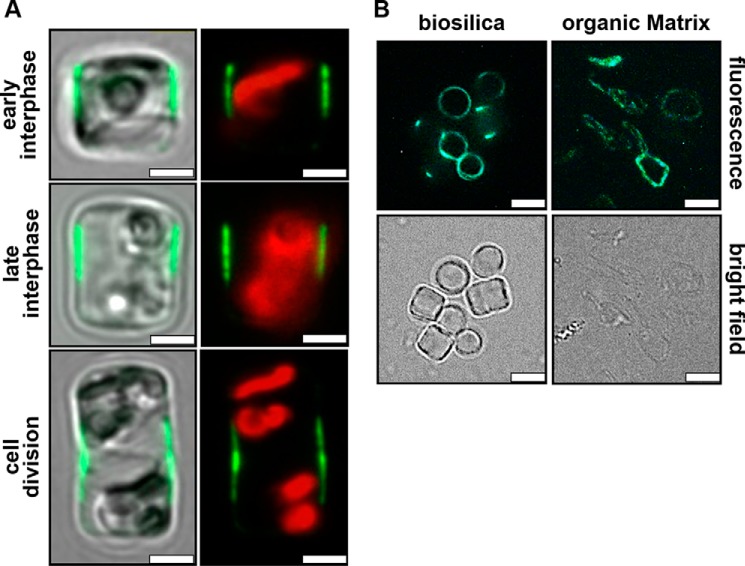
FIGURE 6.
Localization of SiMat1-GFP in T. pseudonana. A, confocal fluorescence microscopy images of individual live cells (girdle band view) at different stages of the cell cycle expressing SiMat1-GFP under control of its own promoter. The left column shows an overlay of the GFP fluorescence (green) with the bright field image of the cells. The right column shows the fluorescence image only including the red chloroplast autofluorescence. Scale bars, 2 μm. B, epifluorescence microscopy (top row) and bright field images (bottom row) of biosilica and insoluble organic matrices isolated from SiMat1-GFP-expressing transformant cells. Scale bars, 3 μm.

