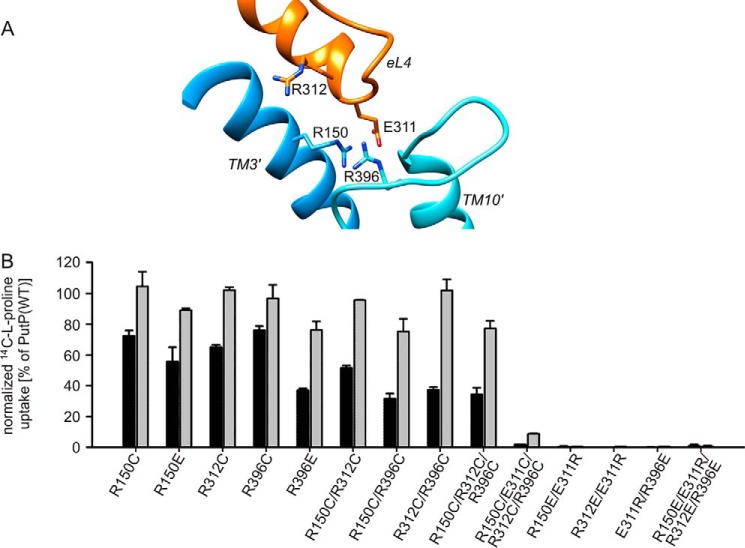
FIGURE 4.
Role of Arg residues near Glu-311. A, zoom into the PutP model shown in Fig. 1 highlighting eL4 and Arg-150 (TM3′, blue), Arg-312 (eL4, orange), and Arg-396 (loop between TMs 9′ and 10′, turquoise) in the vicinity of Glu-311 (eL4, orange). B, impact of the substitution of the Arg residues on sodium-coupled proline uptake. Transport was analyzed as described in the legend of Fig. 2. Normalized initial rates of transport (black) and maximum accumulation of proline inside the cells (gray) are shown as percentage of wild-type values. Transport activities are normalized to the amount of PutP based on Western blot analysis. Standard deviations were calculated from triplicate determinations of a representative experiment.

