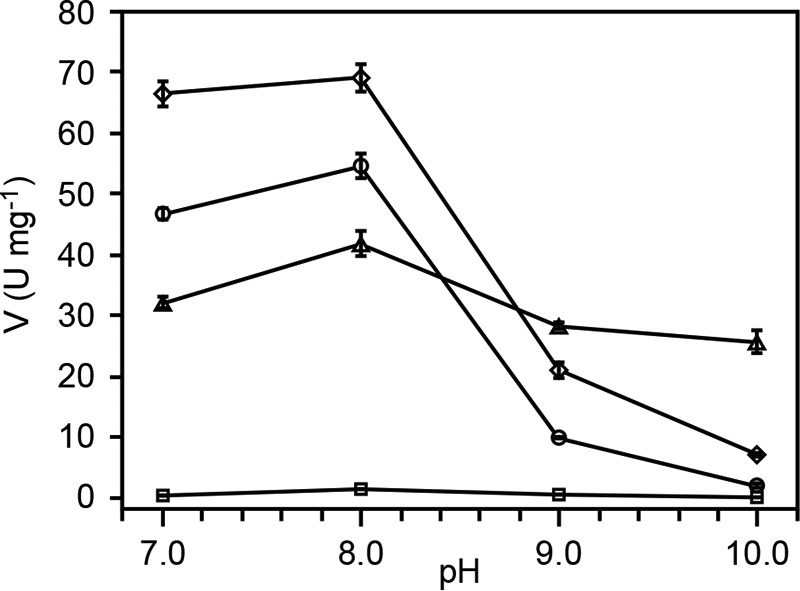
FIGURE 8.

LigE and LigF pH rate profile. The effect of pH on β-etherase activities was determined for each enzyme, revealing that LigE (triangles), LigF (circles), LigFΔ242 (diamonds), and LigFΔ242-S13A (squares) have pH optima at pH 8.0. Plotted as a function of pH (x axis) are the specific enzymatic activities (y axis) of β-etherases with either (βR)-FPHPV (LigE) or (βS)-FPHPV (LigF, LigFΔ242, and LigFΔ242-S13A) as the assay substrate (1.5 mm initial concentration). Error bars, S.D. of triplicate measurements.
