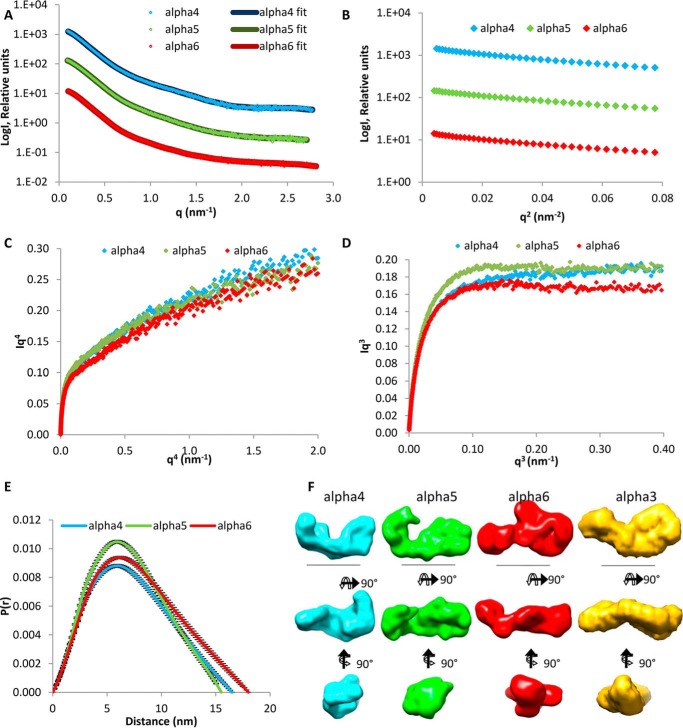
FIGURE 3.
SAXS data collected for the N-terminal regions of the collagen VI α4, α5, and α6 chains. A, SAXS profile showing the log of x-ray scattering intensity (LogI) as a function of the scattering vector q for the experimental scattering data with the DAMMIN fit with lowest χ value superimposed. B, Guinier plot (logI versus q2) of the low q region of the x-ray scattering data where the radius of gyration (Rg) can be measured from the gradient of the slope (−Rg2/3). C, q4 plot does not show a plateau, whereas the q3 plot (D) has a linear plateau that indicates some flexibility in the N-terminal regions. E, P(r) distribution plot shows the probability of different distances found within the protein. The longest distance is indicated by the Dmax. F, ab initio models generated from the SAXS data shown in three orthogonal orientations. Scale bar, 10 nm. For all panels, the α4, α5, and α6 chains are shown in blue, green, and red, respectively. The ab initio model of the α3 N9 to N1 region from Ref. 24 is shown in yellow for comparison.

