FIGURE 4.

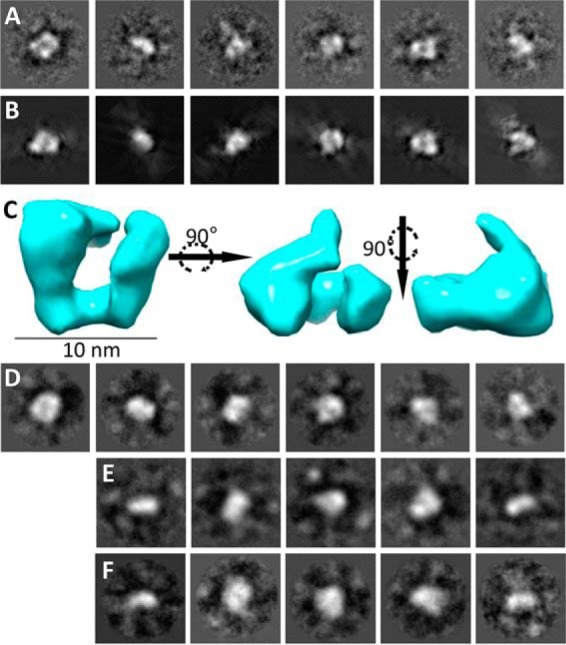
Nanostructure of the N-terminal region of the collagen VI α4 chain and comparison with the N-terminal regions of the α3, α5, and α6 chains. A, representative class averages of the α4 chain generated by reference-free classification using the IMAGIC-5 image processing and analysis software (Image Science, Germany). These class averages were used to generate the three-dimensional reconstruction. B, back-projections of the three-dimensional reconstruction, showing similarity to corresponding class averages. C, three-dimensional reconstruction of the N-terminal region of the α4 chain generated by single particle analysis shown in three orthogonal views. Scale bar, 10 nm. Representative class averages generated by reference-free classification using the IMAGIC-5 software for the α3 (D), α5 (E), and α6 chains (F). All boxes have a size of 35.8 × 35.8 nm.
