FIGURE 13.

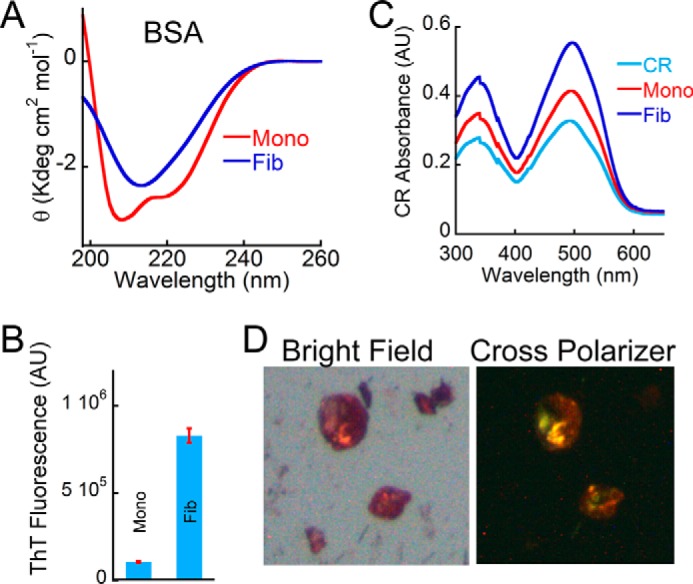
Biophysical characterization of BSA amyloids. A, far-UV CD spectrum of BSA monomer and BSA aggregates (formed in the presence of 300 mm NaCl at pH 3.0) showing helical and β-sheet-rich secondary structure, respectively. B, ThT fluorescence showing higher ThT binding for BSA incubated in the presence of salt and low pH. BSA monomer showed negligible ThT binding. Error bars, S.E. C, CR absorbance spectrum showing higher CR absorbance of BSA aggregate. CR alone was used as a control. D, BSA aggregate formed in the presence of salt and low pH showed greenish yellow CR birefringence under cross-polarized light, indicating the amyloidogenic nature of this aggregate. The corresponding bright field image is also shown on the left. AU, arbitrary units.
