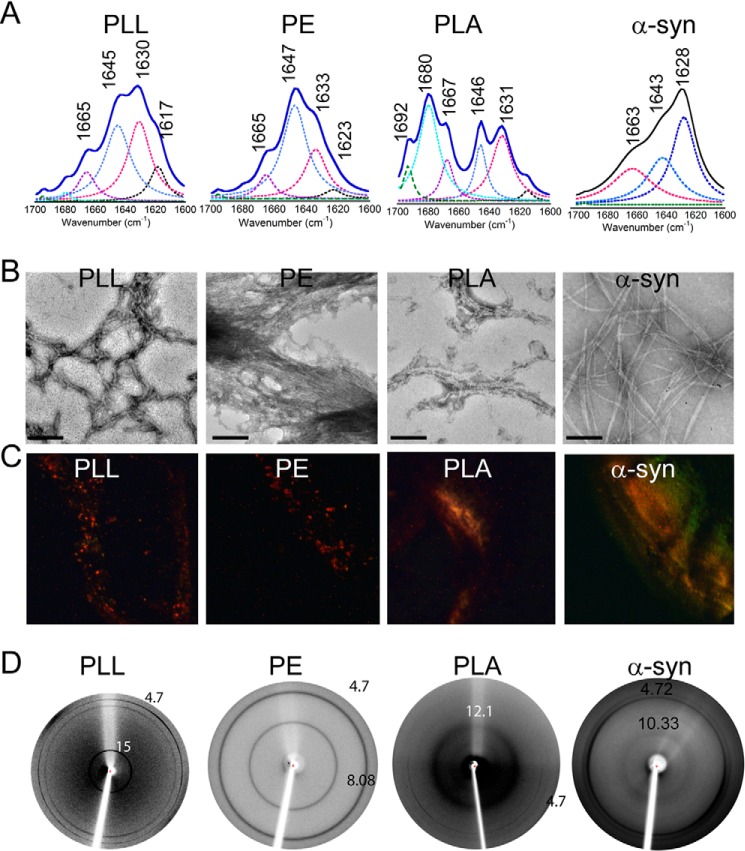
FIGURE 15.
Amyloid formation by PAAs. A, FTIR spectra of PLL, PE, and PLA showing peaks at 1630 and 1617 cm−1, 1633 and 1623 cm−1, and 1631 and 1615 cm−1, respectively, indicative of β-sheet-rich structure in incubated PAAs. B, TEM images of PAA aggregates showing fibrillar morphology. Scale bars, 200 nm. C, PAA fibrils showing greenish yellow CR birefringence under cross-polarized light, revealing their amyloidogenic nature. D, x-ray diffraction pictures of PAA fibrils showing meridional reflection at ∼4.7 Å and equatorial reflection at ∼8–15 Å. α-Syn fibrils were used as a positive control.

