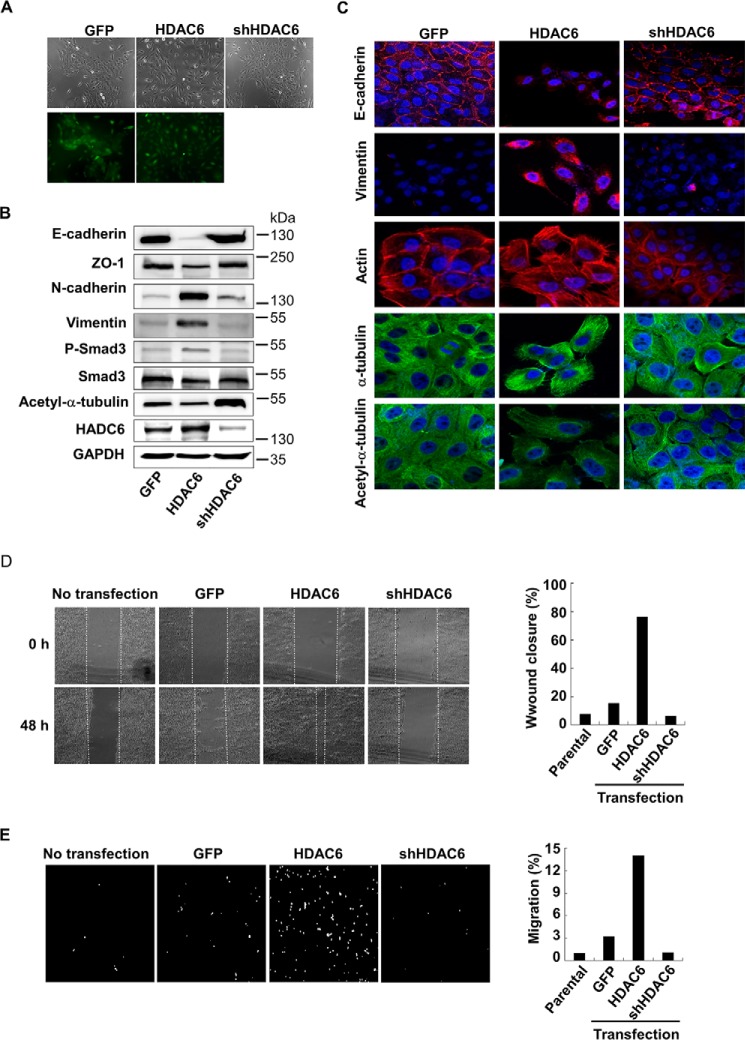
FIGURE 7.
Increased expression of HDAC6 induces EMT. A, morphology of MCF-10A cells stably expressing GFP (control), HDAC6, or shHDAC6. Cells were examined under a fluorescence microscope. Top, bright field; bottom, GFP fluorescence. B, HDAC6 induces EMT marker expression. MCF-10A cells stably expressing GFP (control), HDAC6 or shHDAC6 were subject to immunoblotting analysis using antibodies against E-cadherin, ZO-1, vimentin, N-cadherin, HDAC6, P-Smad3, Smad3, acetyl-α-tubulin, and α-tubulin. C, decreased acetyl-α-tubulin is correlated with EMT marker gene expression. Confocal laser scanning microscopy was used to analyze the levels of E-cadherin, vimentin, actin, acetyl-α-tubulin, and α-tubulin. Magnification 100×. D, HDAC6 promotes cell motility. Confluent monolayer of MCF-10A cells were scratched with a pipette tip to create a cell-free area. 24 h after addition of TGF-β (2 ng/ml), the wound closure was recorded by microphotography of the same region (Left). Quantification of cell motility (Right) was done by measuring the distance between the invading front of cells in three random selected microscopic fields for each condition and time point. The degree of motility is expressed as percentage of wound closure as compared with untransfected cells. E, HDAC6 promotes cell invasiveness. MCF-10A cells were cultured in the Transwell culture chambers with an 8-μm pore-size polycarbonate filter according to the manufacturer's instructions. 24 h later, invaded cells that were attached to the lower surface of the filter were stained with DAPI. The slices were imaged (Left). Quantification (Right) was by counting cell number in the lower surface. The degree of invasiveness is expressed as percentage of total cells seeded as compared with untransfected cells.

