FIGURE 10.
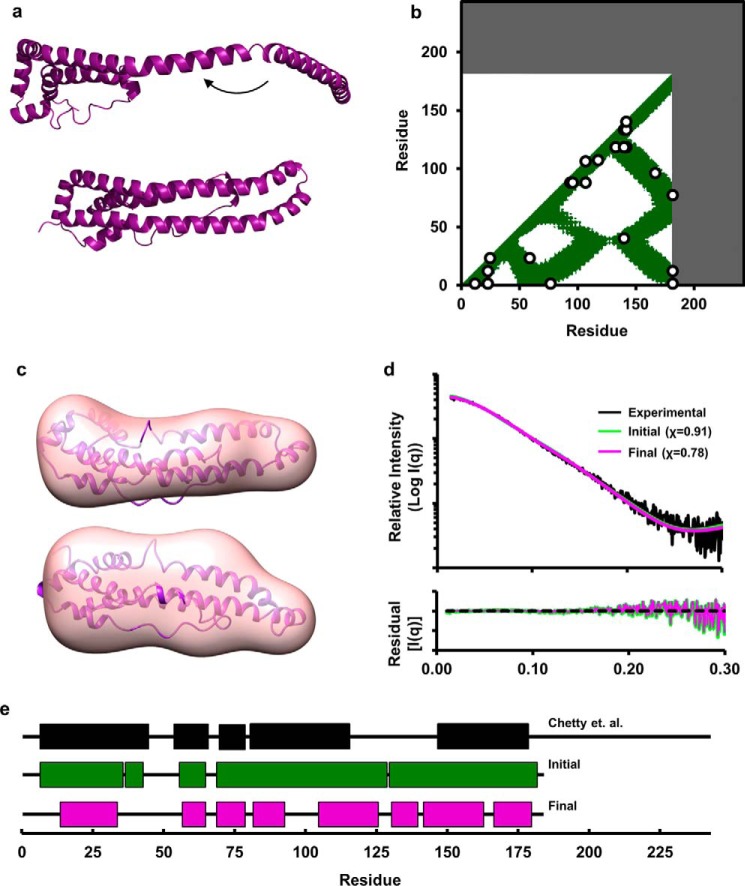
AllosMod-FoXS modeling of the monomeric apoA-IΔ185–243. a, derivation of the initial model as postulated by Mei and Atkinson (12). b, cross-linking data from Tables 1 and 2 superimposed on a molecular contact blot generated for the theoretical model. c, single best fit conformation from AllosMod-FoXS output superimposed on the molecular envelope. d, comparison of the experimental monomeric apoA-IΔ185–243 x-ray scattering profile (black line) to the single best fit initial (green line) and final (purple line) profiles generated by AllosMod-FoXS. e, regions of α-helicity in our final model of monomeric apoA-I Δ185–243 (magenta) versus that determined in monomeric full-length apoA-I by Chetty et al. (44) (black) and the crystal structure (green). The boxes represent α-helical segments.

