
FIGURE 3.
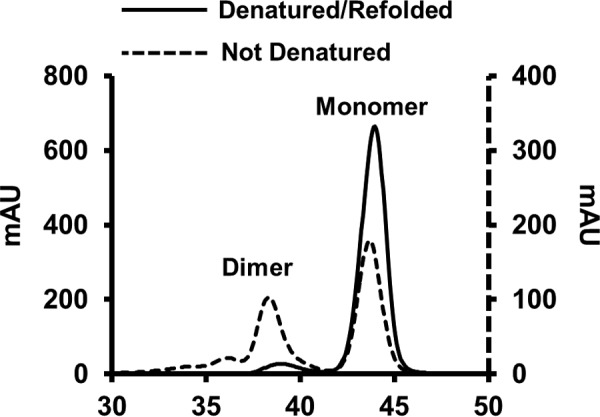
Redistribution of lipid-free apoA-IΔ185–243 after denaturation and reassembly. Distribution of dimeric and monomeric apoA-IΔ185–243 before (dotted line) and after denaturation and reassembly (solid line) using size exclusion chromatography.