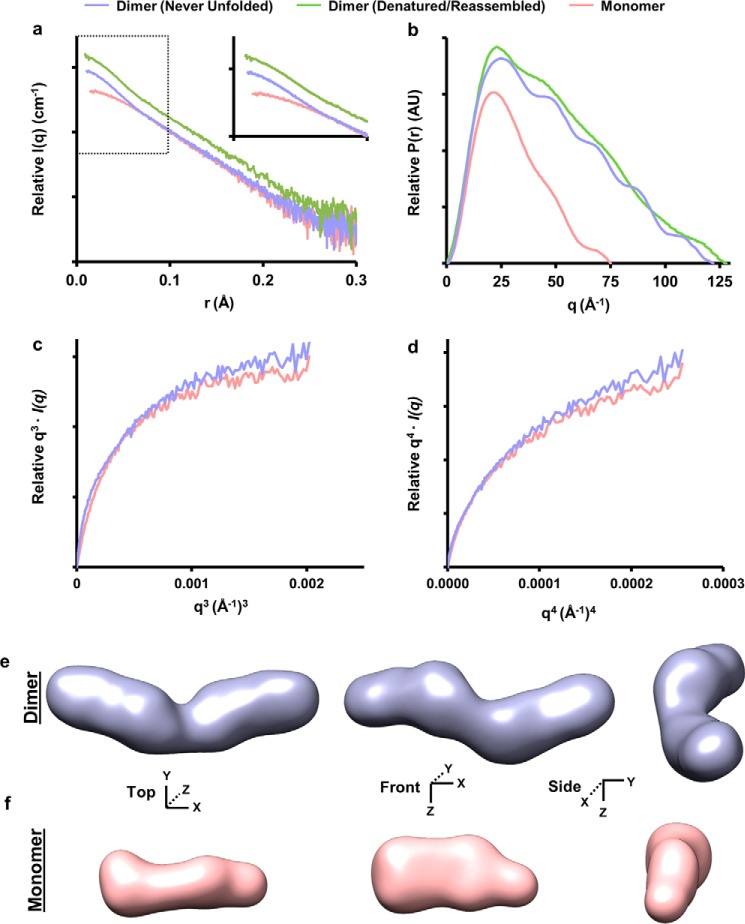
FIGURE 5.
SAXS analysis of lipid-free apoA-IΔ185–243 dimer and monomer. a, intensity distribution of the SAXS scattering function of both dimer isolations (purple and green) and the monomer (tan). b, pairwise distribution function where AU equals arbitrary units. c, q3·I(q) versus q3(Å−1)3. d, q4·I(q) versus q4(Å−1)4. e and f, the SAXS ab initio reconstructions of the dimeric (e) and monomeric (f) apoA-IΔ185–243. The envelopes were generated using DAMMIF and DAMAVER. The averaged envelope was rendered and displayed using UCSF Chimera. The data were from three samples each at a different concentration. Each concentration was run at four different exposure times.

