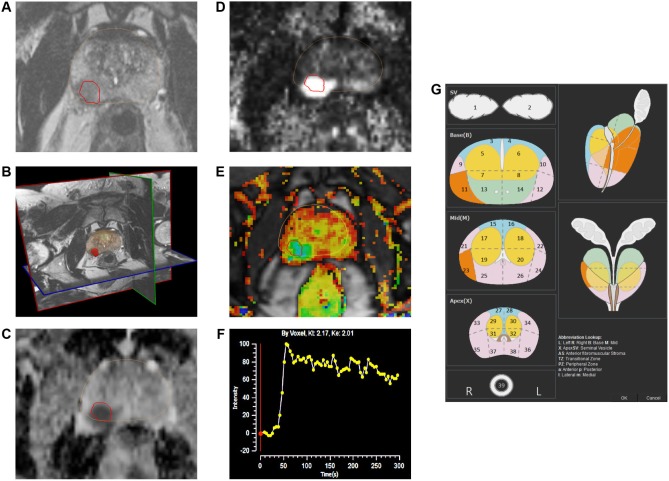
Figure 4.
The mpMRI depiction of right posterolateral lesion: (A) axial T2-weighted image with lesion in red outline, (B) 3D T2-weighted view of prostate contour (brown) and lesion (red), (C) ADC image with lesion in red outline, (D) computed high b-value = 2000 seconds/mm2 image with lesion in red outline, (E) dynamic contrast-enhanced pharmacokinetic map with lesion in red outline, (F) average time–signal intensity curve plot of the lesion, and (G) PIRADS version 2 location of lesion (orange).

