Figure 2.

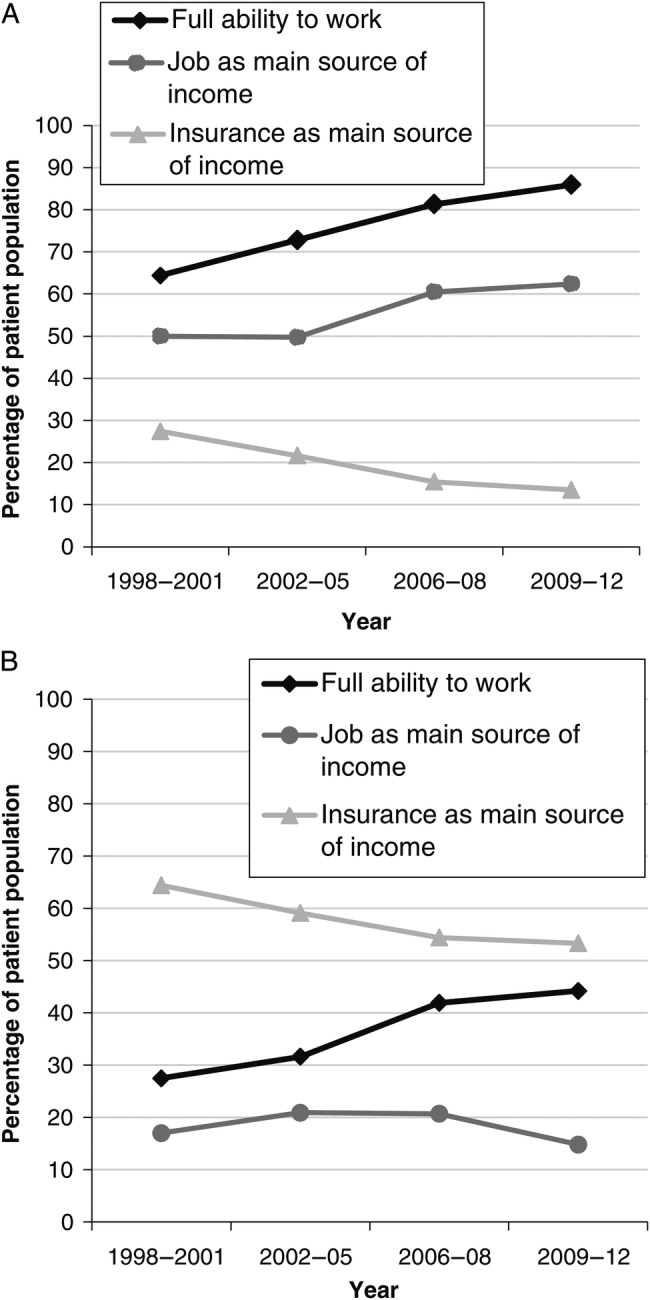
Full ability to work and primary sources of income over time (A) at baseline in the study population (n = 5800) and (B) at 1 year of combination antiretroviral therapy in patients who were unable to work at baseline (n = 947).

Full ability to work and primary sources of income over time (A) at baseline in the study population (n = 5800) and (B) at 1 year of combination antiretroviral therapy in patients who were unable to work at baseline (n = 947).