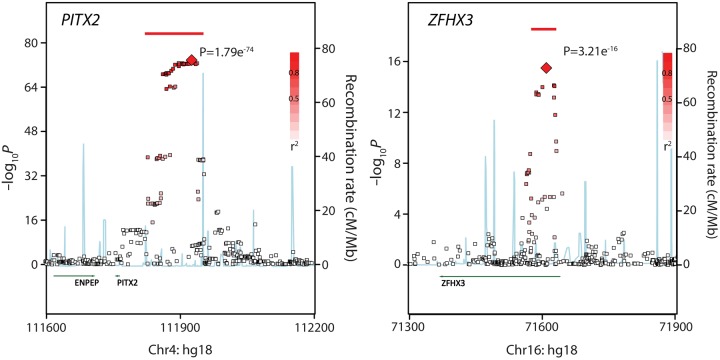
Figure 2.
Regional plot for AF association signals on chromosomes 4 and 16. Each point represents a single SNP with association level displayed on the left Y-axis. Red bars indicate the top linkage dissociation block that is approximately equivalently associated with altered risks of AF. Blue lines indicate peaks of recombination, with strength being displayed on the right Y-axis. Note that the region associated with AF in (A) (indicated by the red SNPs and bar) is quite large and at a great distance upstream of the closest gene, PITX2. In contrast, in (B), the AF-associated SNPs/region is considerably smaller and is located within the gene ZFHX3.

