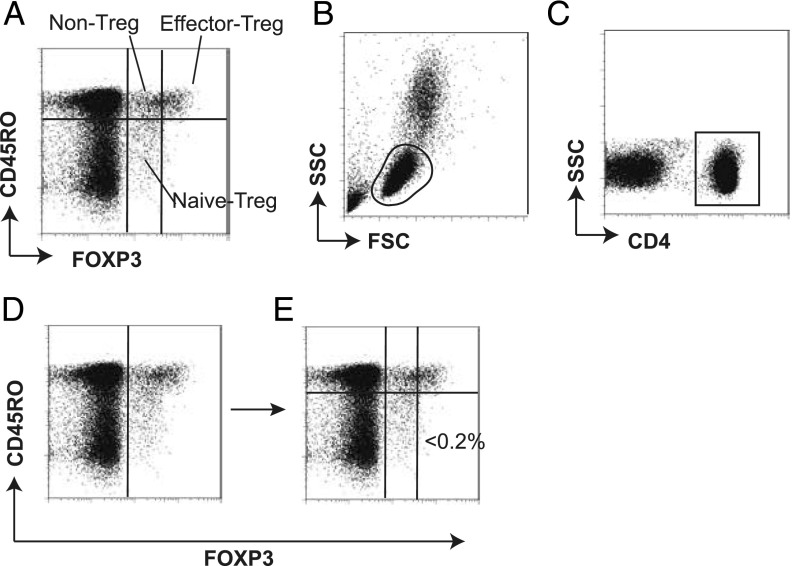
FIGURE 1.
Manual gating approach to classify the FOXP3+ T cell subpopulations. The manual gating approach to identify and classify FOXP3+ T cell subpopulations is depicted. (A) Representative flow cytometric data showing the three subsets of FOXP3+ T cells in PBMCs: CD45RO+FOXP3high effector Treg, CD45RO−FOXP3low naive Treg, and CD45RO+FOXP3low non-Treg. These subpopulations are classified in a sequential manner using the following four gates: (B) the lymphocyte gate on the window displaying FSC and SSC, (C) the CD4+ gate using CD4 and SSC, (D) the FOXP3+ gate using FOXP3 and CD45RO, and (E) the FOXP3+ T cell subpopulation gate using FOXP3 and CD45RO. The level of FOXP3high and FOXP3low cells was determined so that CD45RO−FOXP3high cells were <0.2% of CD4+ T cells.

