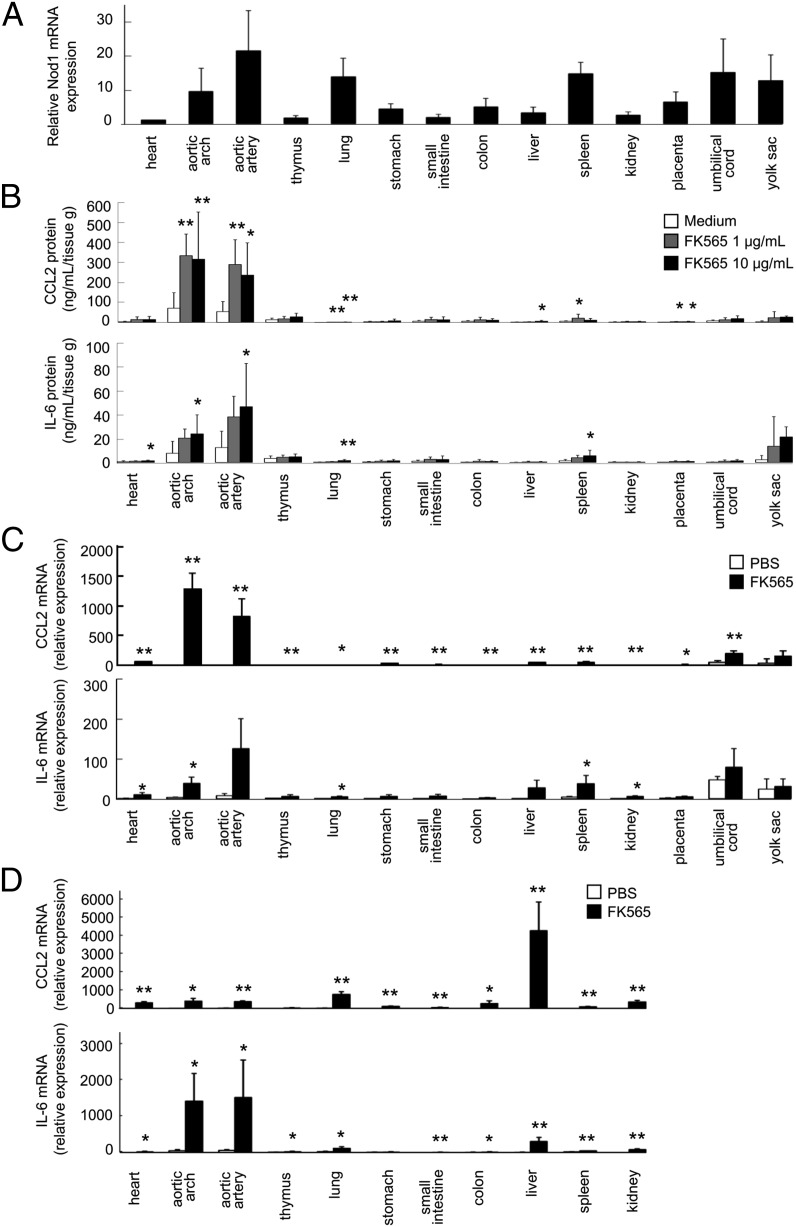
FIGURE 4.
Nod1 expression and cytokine production in responses to Nod1 ligand (FK565) stimulation in various tissues of the fetus. (A) Nod1 expression levels in various tissues of normal fetal mice at E18.5. The mRNA expression levels were determined by real-time quantitative PCR with Gapdh as the internal control. The relative Nod1 mRNA expression levels in each tissue were determined relative to the mRNA level in heart (set as 1.0). The bar indicates mean and SD (n = 3). (B) The production of cytokines in various tissues of normal fetal mice at E18.5 ex vivo treated with FK565. Each bar indicates mean and SD (n = 8 for each group). *p < 0.05, **p < 0.01 relative to medium (Dunnett test). (C) The expression of cytokines in various tissues of fetal mice from pregnant mice treated with FK565 at a dose of 500 μg on E18.5. The relative mRNA expression levels in each tissue were determined relative to the mRNA level in heart treated with PBS (1.00). Each bar indicates mean and SD (n = 3 for each group). *p < 0.05, **p < 0.01 relative to each tissue treated with PBS (Student t test). (D) The expression of cytokines in various tissues of pregnant mice treated with FK565 at a dose of 500 μg on E14.5. The relative mRNA expression levels in each tissue were determined relative to the mRNA level in heart treated with PBS (1.00). Each bar indicates mean and SD (n = 3 for each group). *p < 0.05, **p < 0.01 relative to each tissue treated with PBS (Student t test).

